
When a student applies in the Early Decision round, he/she is making a commitment to a college that, if admitted, he/she will withdraw applications from all other institutions and definitively attend the Early Decision institution. For years, it has been a way for institutions to shore up a portion of enrollment early.
While Early Decision applications only make up about 2% of the applicant pool, they produce roughly 8% of total enrollment across all MARKETview partners.
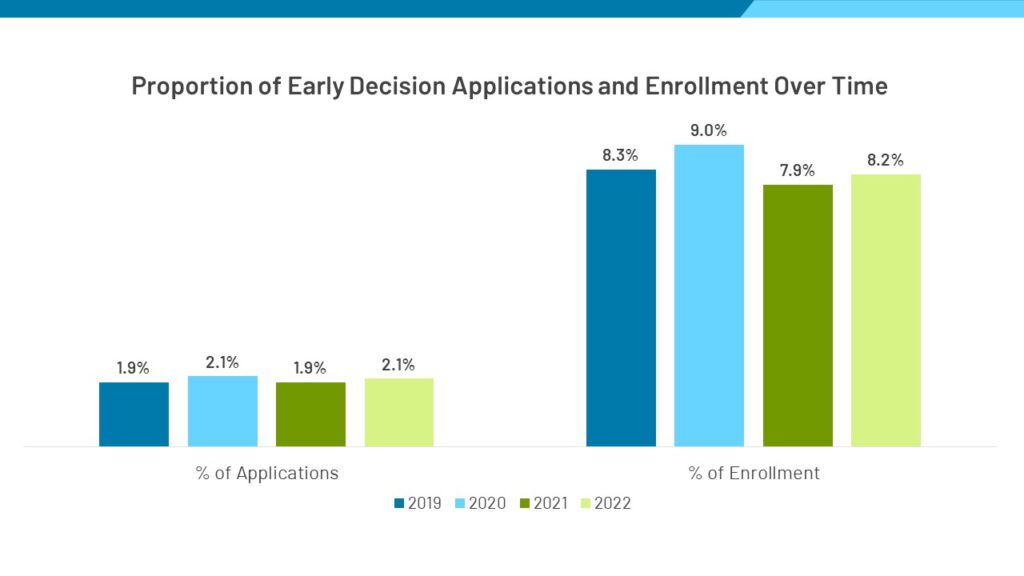
In the first pandemic year (2020), the Early Decision round made up 9% of enrollment for MARKETview partners – the highest proportion in recent history. The colleges that had an Early Decision round benefitted, as they had a population that was formally committed before the pandemic hit. The following year (2021), however, students and families were less willing to commit early given Covid-inspired uncertainty, dropping the proportion of overall enrollment from Early Decision down to 7.9%.
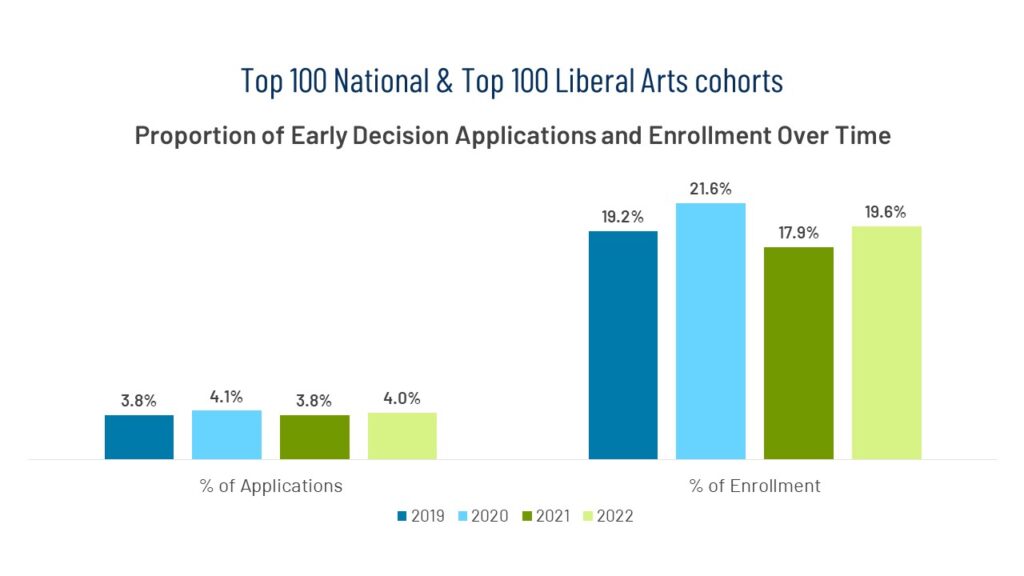
A similar spike in 2020 and sharp drop in 2021 were visible across MARKETview’s most selective institutions, as well. The difference is that MARKETview’s Top 100 National and Top 100 Liberal Arts Cohorts generate nearly 20% of overall enrollment from the Early Decision round – an envious position for other institutions across the country.
Though the proportion of overall enrollment generated from Early Decision is dramatically higher for the more selective institutions, the types of students applying Early Decision are similar, regardless of the institution type.
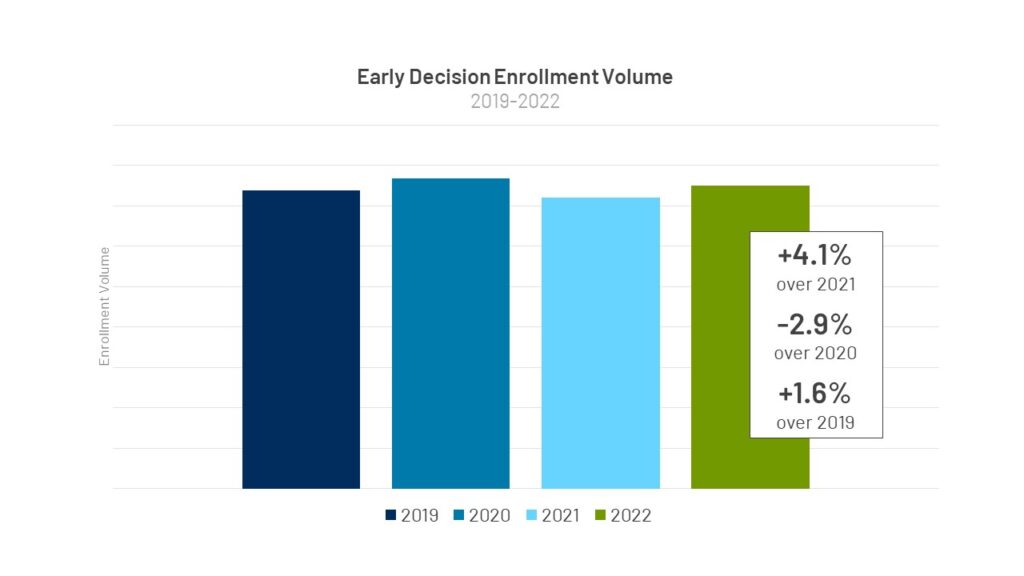
In terms of volume across MARKETview partners, Entering Class of 2022 enrollment from Early Decision was up 4.1% over 2021 but down 2.9% over 2020 (remember, these students would have applied in Fall 2019 prior to Covid).
Let’s take a look at the MARKETview Early Decision pool through several different lenses.
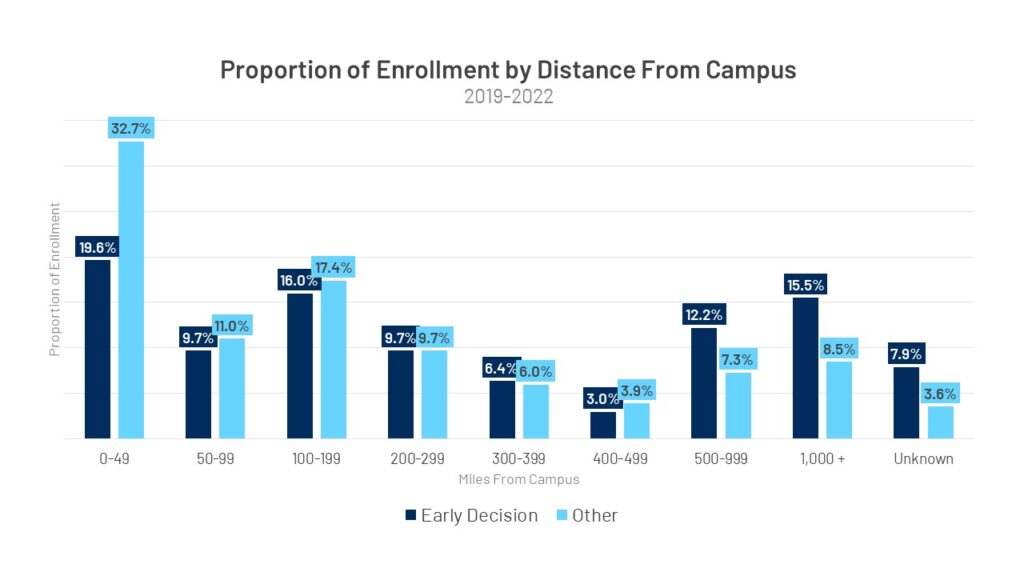
DISTANCE FROM CAMPUS:
When it comes to Distance From Campus, 35.6% of Early Decision students enrolling live more than 500 miles from campus, compared to only 19.4% of enrolling students who applied in other rounds.
Alternatively, students choosing not to apply Early Decision tend to live closer to the institution at which they enroll. The chart below shows 32.7% of non-Early Decision students enrolling live within 50 miles of campus compared to only 19.6% of Early Decision students.
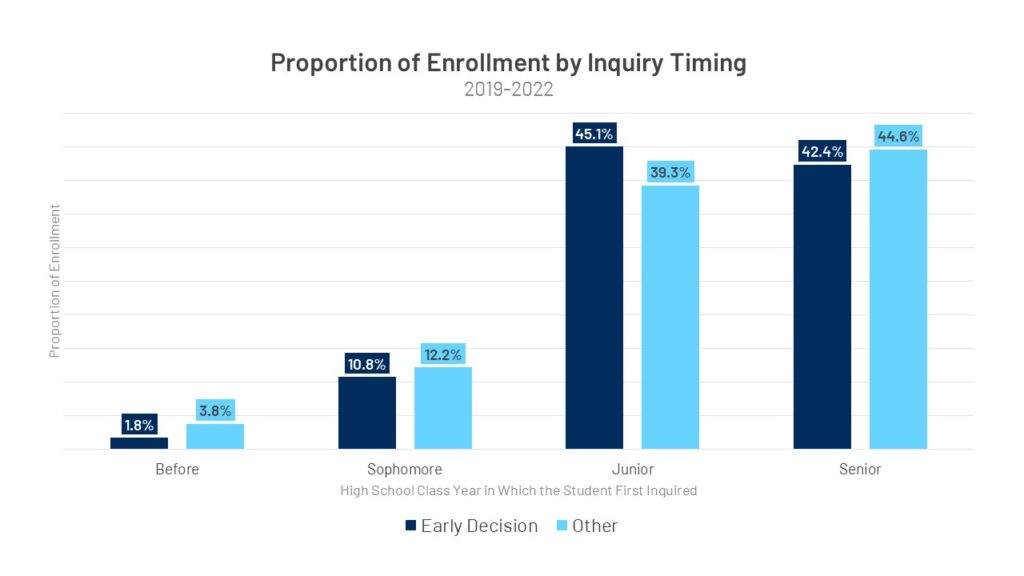
INQUIRY TIMING:
The distribution of enrollment by when a student first inquires is relatively similar for Early Decision and non-Early Decision students, though a slightly higher proportion (5.8 percentage points) of Early Decision enrollment comes from students who first inquired in their Junior year of high school.
INQUIRY SOURCE:
Within MARKETview, Inquiry Sources from every partner are standardized into 14 categories. Three particular sources are called out below because of the significant differences between Early Decision and non-Early Decision students in terms of contribution to enrollment.
First, only 6.3% of enrollment from Early Decision students first inquired with the application itself. These students were not visible in the inquiry pool prior to submitting an application. Alternatively, 18.4% of enrollment from non-Early Decision came from students whose first source of known engagement with the institution was an application.
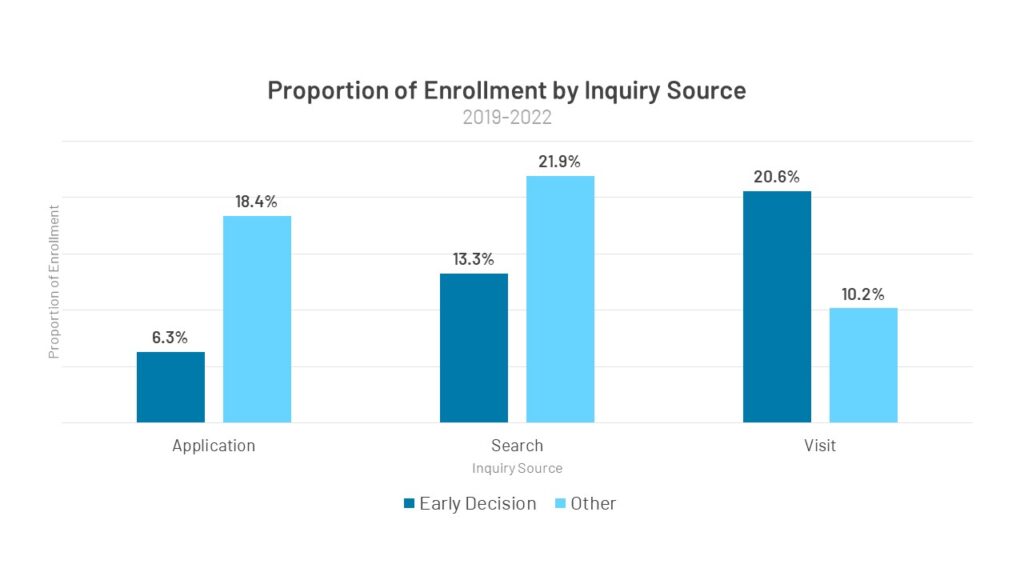
Second, Search is a smaller contributor to Early Decision enrollment (13.3%) than non-Early Decision enrollment (21.9%).
Third, more than 20% of Early Decision enrollment first engaged with the institution by visiting campus compared to 10.2% of the non-Early Decision enrollment.
The bottom line? Students applying Early Decision are much more likely to express interest to institutions on their own by visiting campus, engaging with athletics teams, submitting test scores, and taking part in other self-initiated activities. Students choosing not to apply Early Decision are more likely to be discovered by college-generated efforts such as Search and marketing.
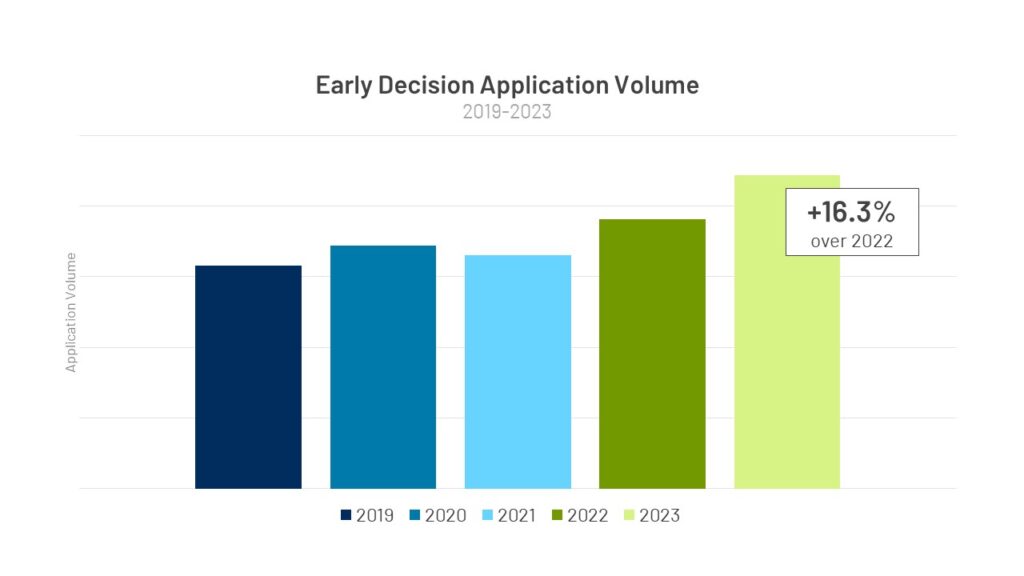
Early Decision This Cycle
We’ve been watching the MARKETview Early Decision population closely to understand Covid’s potential impact on this decision round, but there are no signs of it losing significance. Early Decision applications for the Entering Class of 2023 are up 16.3% over 2022, whereas non-Early Decision applications have only seen a lift of 4.8%, to date.
Subscribe here for more MARKETview content like this.