
MARKETview has been monitoring the data behind the “Covid Class” — the enrolling class of 2023, whose entire college search journey has been influenced by the pandemic.
Our last two blog posts focused on Inquiry and Applicant pools. In this post, we’ll discuss trends and insights in the next stage of the funnel: Admits.
Below are three primary observations:
1) The National Lift in Admit Volume Has Been Driven by Publics
In looking at MARKETview’s National cohort, which is comprised of more than 130 colleges and universities across the country, admit volume has been steadily climbing—up 2.1% compared to 2022 and 4.4% compared to 2021. However, that growth is mostly driven by public institutions, which have seen a 9.1% year-over-year increase. Alternatively, year-over-year admit volume for private institutions is down 0.3%.
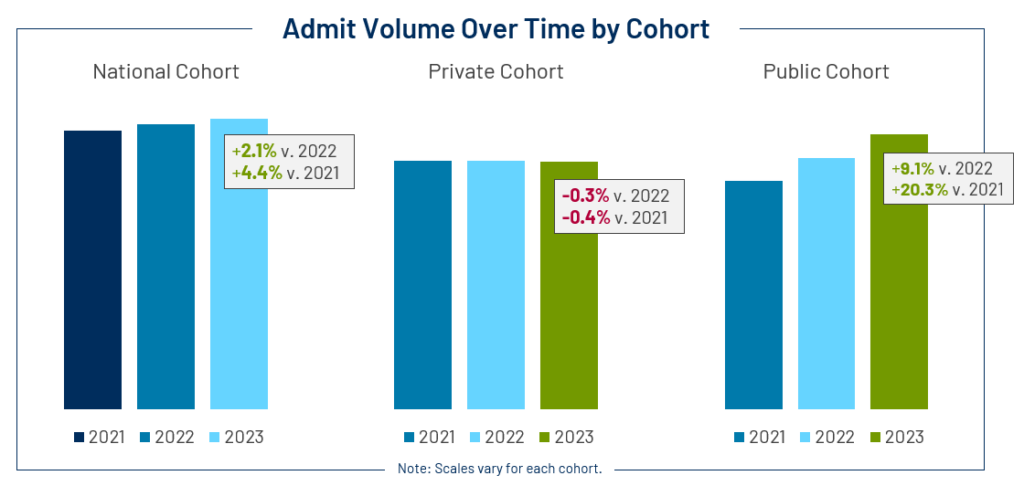
While not all schools are seeking to grow their admitted pools, the chart above suggests students’ demand toward public institutions has continued to grow, while private schools have lost market share.
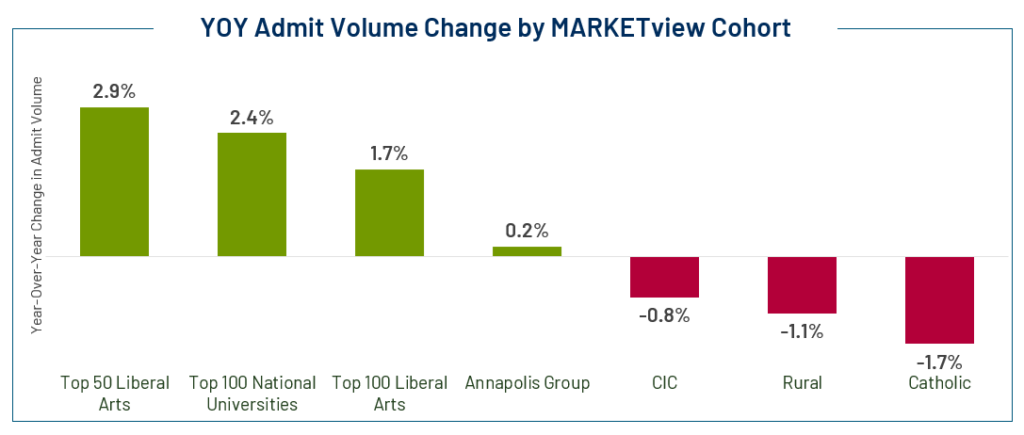
The drop in admits varies by private institution cohort. When we break down the private institutions into smaller cohorts by school type (on average, MARKETview cohorts are comprised of 19 institutions), the Council of Independent Colleges (CIC), Rural, and Catholic cohorts are pulling down the size of the Private cohort’s admit pool. Some of the more selective cohorts such as the Top 50 Liberal Arts, Top 100 Liberal Arts, and Top 100 National Universities cohorts have experienced a lift in year-over-year volume.
2) There Has Been Major Growth in International Admits Across All Cohorts
When we get more in-depth at the cohort level, we see even more bifurcation in admit volume changes. The big story of 2023 is the rise in international admits. The double-digit percentage point lift is present with both private and public cohorts, though the publics have a greater lift (up 36.3% compared to 2022) than the privates (up 18.5% compared to 2022).
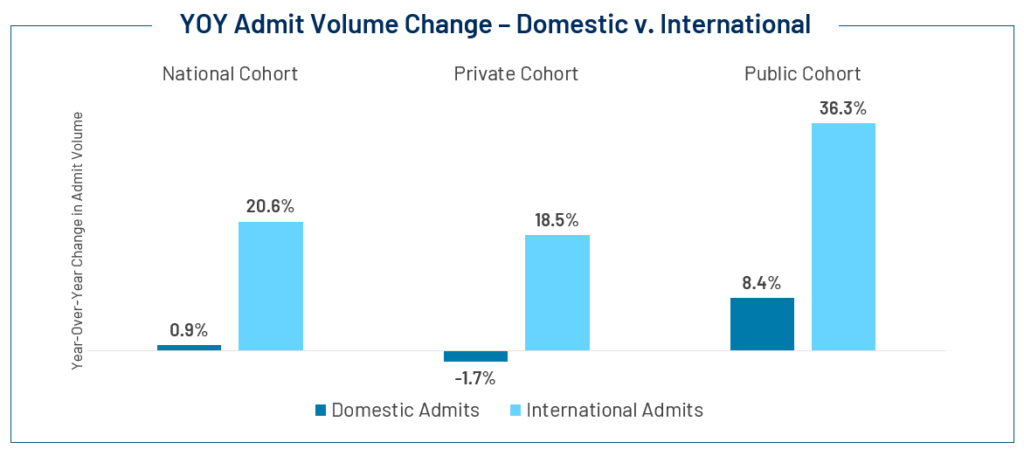
The overall loss in admits among private institutions is masked by the increase in international admits. This is significant because domestic students make up 92.9% of private enrollments. Private institution domestic admits trail -1.7% in year-over-year admit volume compared with publics who have seen 8.4% more domestic admits.
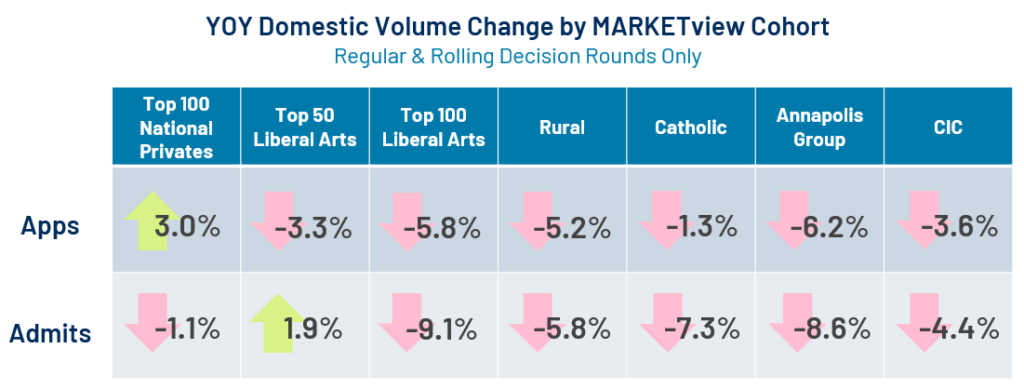
3) The Private Cohort’s Decline in Admits is a Result of a Drop in Regular and Rolling Decision Rounds
Zeroing in on the private cohort’s domestic student population, there is a year-over-year increase in both application and admit volume from Early Decision and Early Action rounds. Overall, admit volume has declined due to the Regular Decision round and students applying to Rolling Decision schools.
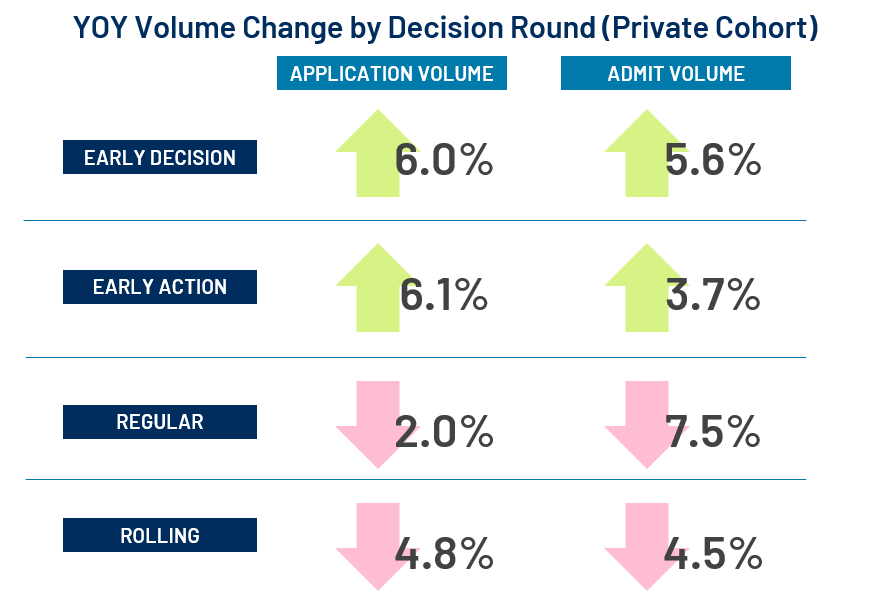
The popularity of Early Decision and Early Action rounds seems to have suppressed application and admit volumes in both Regular Decision rounds as well as students submitting to Rolling Admission schools. Schools almost universally doubled down, admitting fewer students in Regular Decision. The drop in Rolling Decision Applications and Admits appears to be more a symptom of demand than intentionality.
For example, consider the application and admit volume change for Regular Decision and Rolling Decision rounds for some cohorts of private institutions. Our Top 100 National cohort admitted 1.1% fewer students in these rounds this year, despite a 3.0% lead in applications. Other than the 1.9% increase in admits from the Top 50 Liberal Arts cohort, all other cohorts saw a year-over-year decline.
We’ll wrap up our “Covid Class” blog series with a final look at net deposits this summer once the majority of melt has occurred.
Interested in Learning More?
Want to discuss any of these trends in further detail or get a sneak peek at how your institution compares to national trends or your peers’ performance?