Retaining more students in today’s competitive higher-ed market is no easy feat, especially when you lack the quality intel to inform your remediation strategies. MARKETview’s Ben Plache, Ph.D., Director of Client Success, emphasized the importance of broader market knowledge in making these crucial decisions.
“With the absence of market context, you don’t know if your intervention efforts are aligned with where the market data would suggest there’s an opportunity,” Plache said.
In this post, we’ll take a deep dive examining how to use comparative data to pinpoint insights that will lead to targeted areas of improvement for retention on your campus. We looked at retention data from a private New England university, and compared it against MARKETview’s aggregated data set from other similar institutions.
A Real Example of Improving Retention Through Comparative Context
The first thing that stood out — this university’s overall retention leads the private cohort by around three percentage points. If this institution has a goal of improving retention, how would they identify the Critical Elements for achieving that if they’re already leading the pack? Plache illuminated the first step institutions typically take without the context of comparative data.
“Traditionally, most schools are going to focus on students who typically retain worse, and that is generally low-income students, students from far away, and students with a lower academic profile,” Plache said.

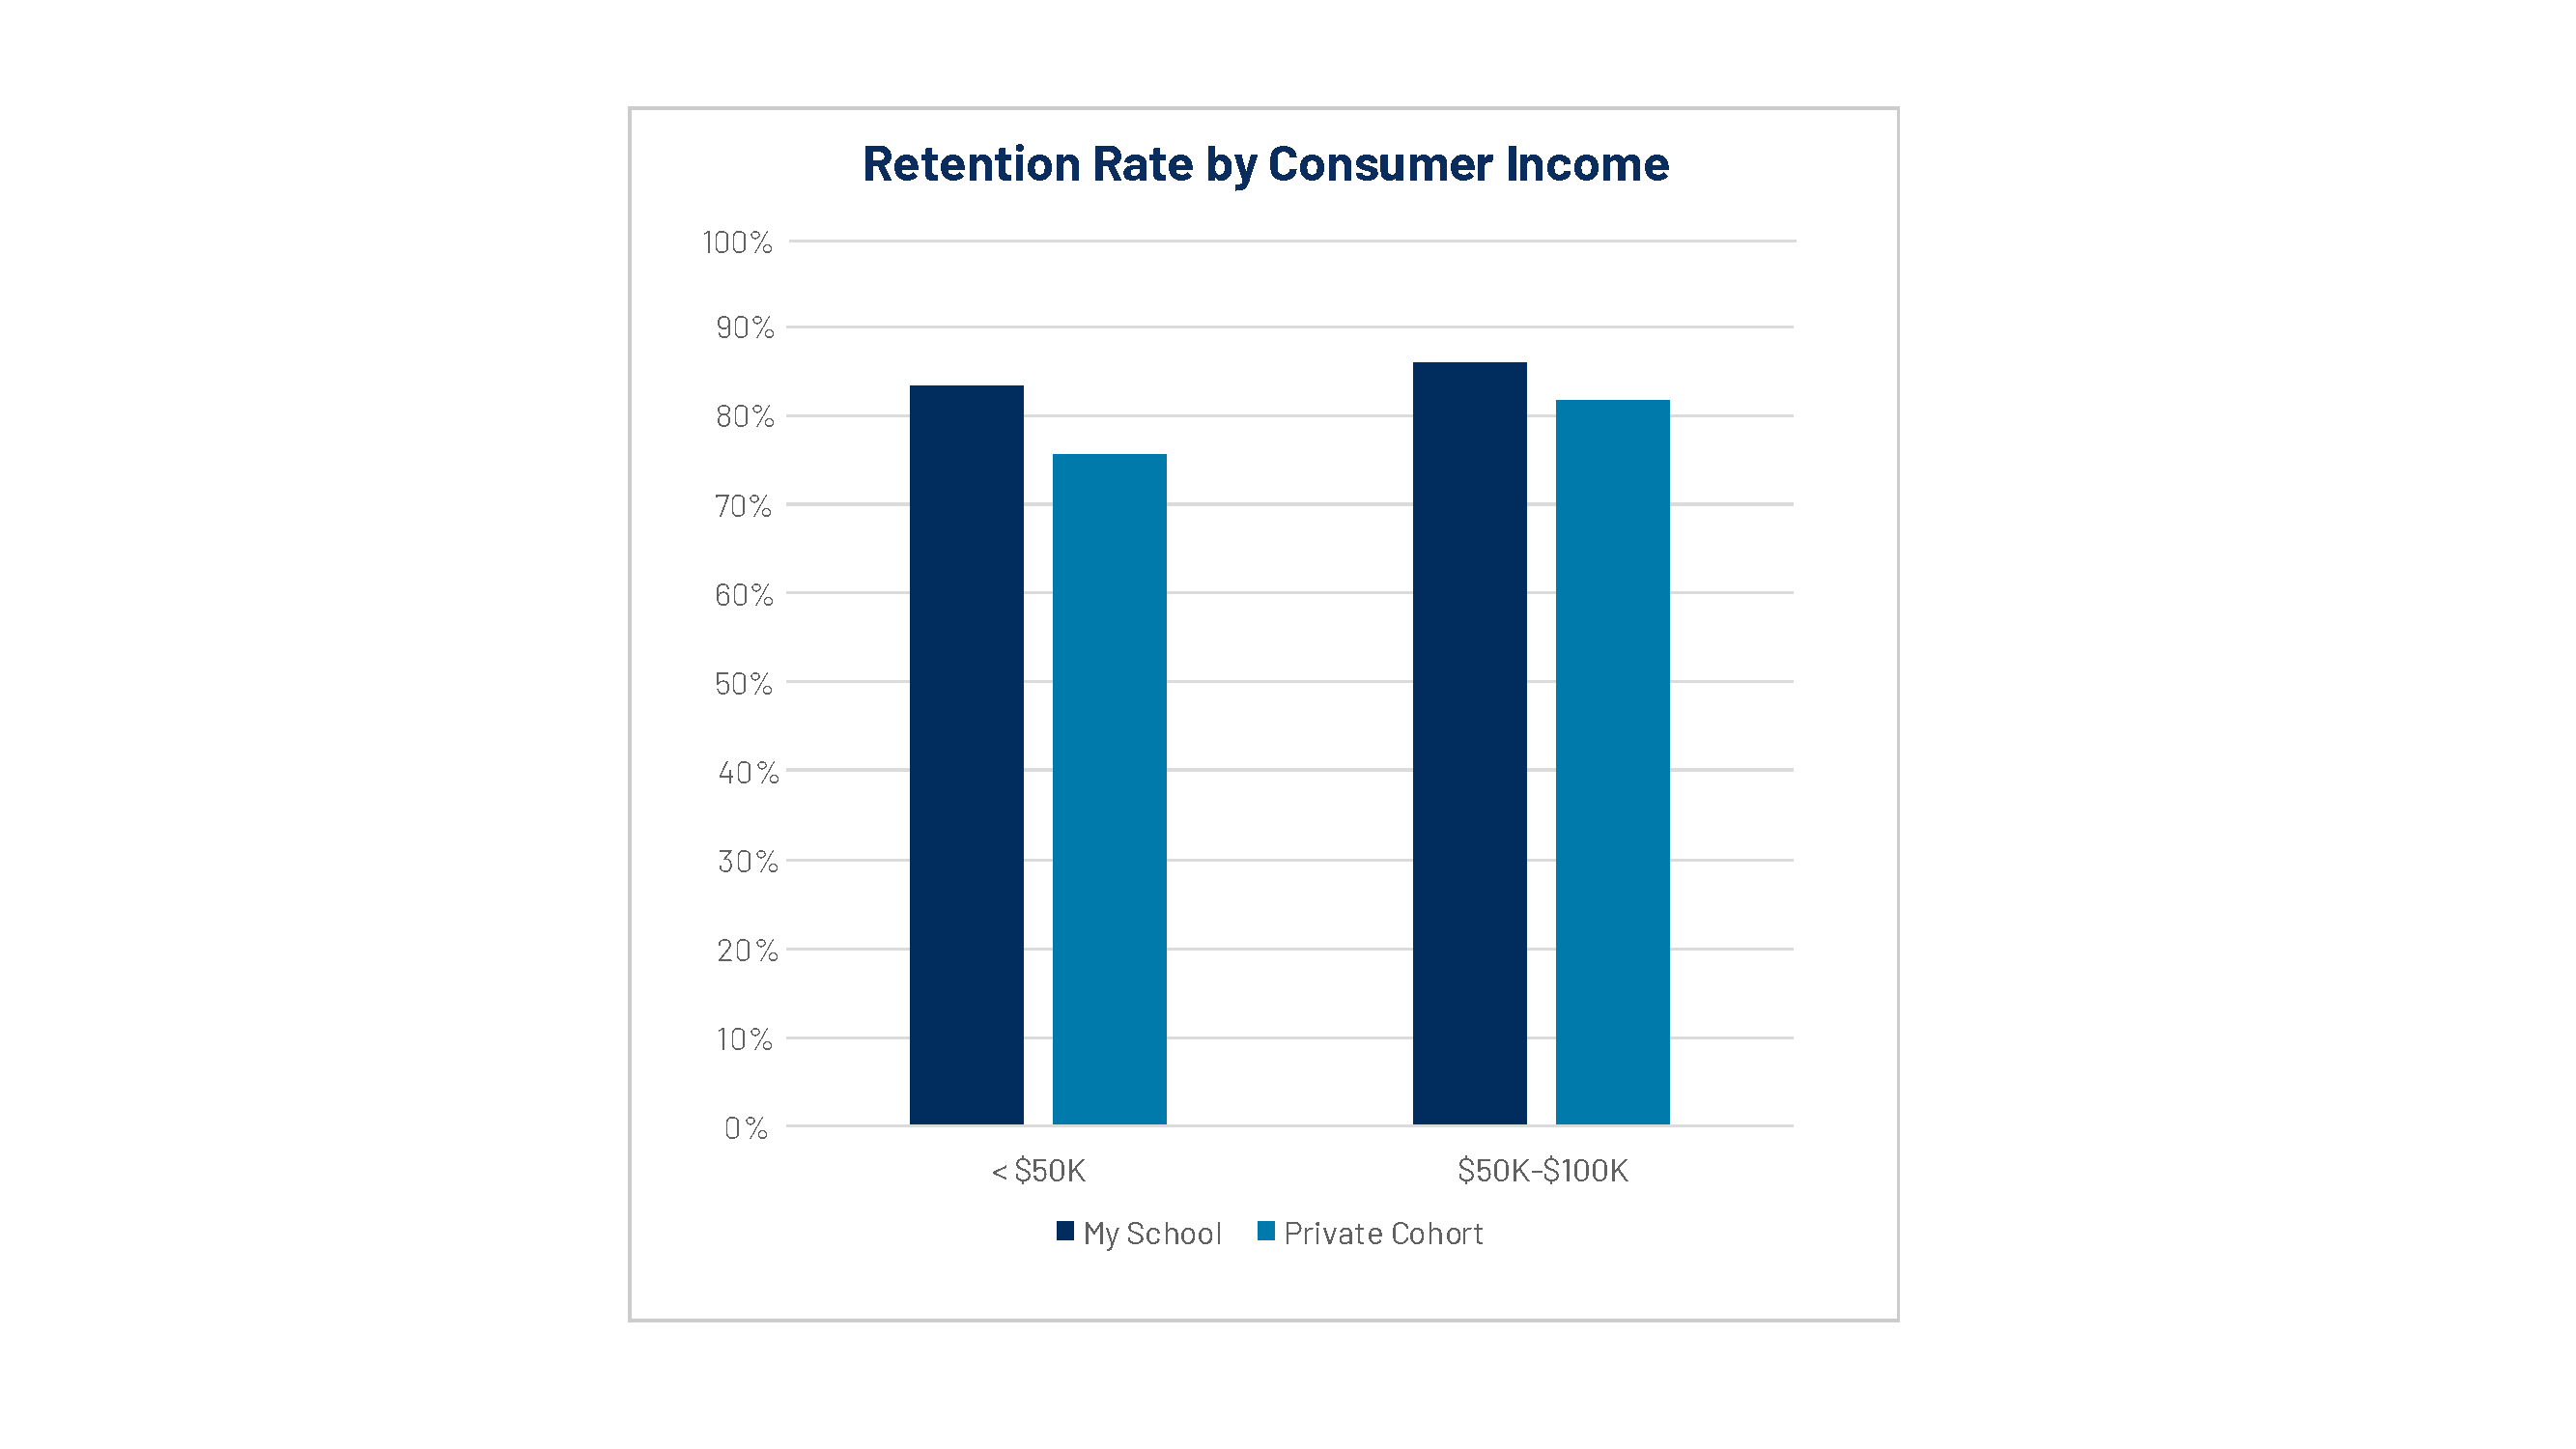
By filtering the data to look at low-income households (income under $100,000), it was found that the university does about five percentage points better than the market overall with this group. The comparative data revealed that the typical assumptions about retention aren’t true for this university. Plache explained how knowing the context of the market can help you identify the areas you truly need to improve instead of just making risky assumptions.
“If you spend all your time focused on low-income students, but you already retain those students better than schools like you, is that a place of opportunity for you?” Plache said. “Or is there another place we can identify in the data where there’s dissonance in how you retain those students?”

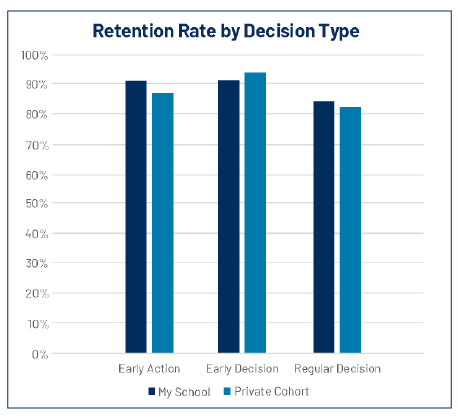
Next, the data was filtered by decision type. This is where we found some interesting insights into where this school might be able to improve its retention strategy. The institution leads the market by two percentage points for retaining Regular Decision (RD) applicants, but they lag the market by two percentage points in Early Decision (ED) retention. Plache highlighted why the ability to filter your comparative data is essential.
“If we were just looking at top-line comparative rates, that [difference] would be masked,” Plache said. “Because [this school] would say, ‘We outperform the market in every metric.’ Well, the truth is you don’t with your ED students.”
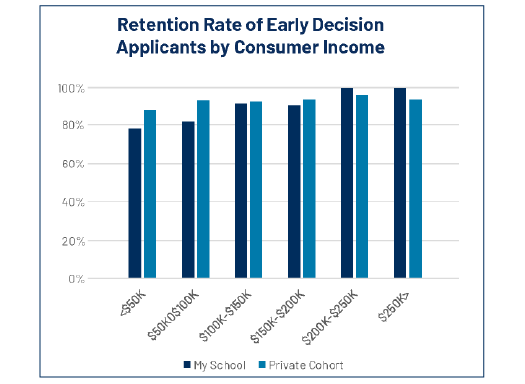
The data showed that ED is a big source of enrollment growth for this university, so it becomes even more important to improve retention with this expanding population. The first step in proving the validity of this diagnosis was determining if the entire ED group trails the market, or just a specific subset. When the earlier consumer income filter was reapplied, the full picture revealed itself. The school added a large amount of low-income ED students, and that specific subset is not retaining well.

The next question to ask was: Is this deficit among low-income ED students true across the market? Comparative data reveals it is not, and there’s a big disparity. The market retains low-income, ED students at 89%, whereas this university retains that same group at only 78%. And it was already determined that this is particularly an ED problem — the data we examined earlier showed this school outperforms the market in retaining low-income students overall. Plache pointed out the essential function of comparative data exhibited by this discovery.
“It’s meaningful on two levels,” Plache said. “One, we can leverage the comparative data to understand how your students behave differently from the market. And two, you can also use the comparative data to understand opportunity.”
The opportunity for this New England private university is that they’ve greatly expanded enrollment for low-income ED students, but they’re retaining them 11 percentage points below the market average, which poses a big risk. With these comparative insights, this school can intervene with programs targeted towards retaining this specific group more effectively, instead of spending budget taking guesses at the right target group.
Comparative Retention in MARKETview
All of the data and insights used in the above exercise was sourced directly from Comparative Retention in MARKETview. This new way of understanding your retention data can’t be found anywhere else in the market. Plache explains how essential this level of insight is in achieving your goals.
“This gives you unparalleled insight into your own data, and now that we’ve layered in the market context, it helps you understand where opportunity is, how you can identify the Critical Elements related to your retention goals and what’s the path towards achieving them.”
Want to learn more about Comparative Retention, or the numerous other ways MARKETview can help you achieve your revenue and enrollment goals? Schedule a live demo with our team!
