
Insights on Early Decision / Early Action Applications and Test Score Submissions
Following our webinar on deposit trends as of May 1, we are sharing our insights in a series of blog posts throughout the month. You can read our annual overview from Part 1 and subscribe to our blog to get alerts for future posts or follow us on LinkedIn for updates.
Below are two key takeaways regarding students’ application preferences and behavior, and what it means for deposits.
Much of the Early Peak Was Explained by Early Decision and Early Action
(Regular Decision and Rolling Admissions are where schools fell behind)
Due to the uncertainty during the pandemic, students moved away from Early Decision and Early Action but have since trended closer to the pre-pandemic baseline. For private institutions, admit and net deposit volumes were up for both Early Decision and Early Action applicants. Regular and Rolling Decision applications, admits and net deposit volumes were down across the board.
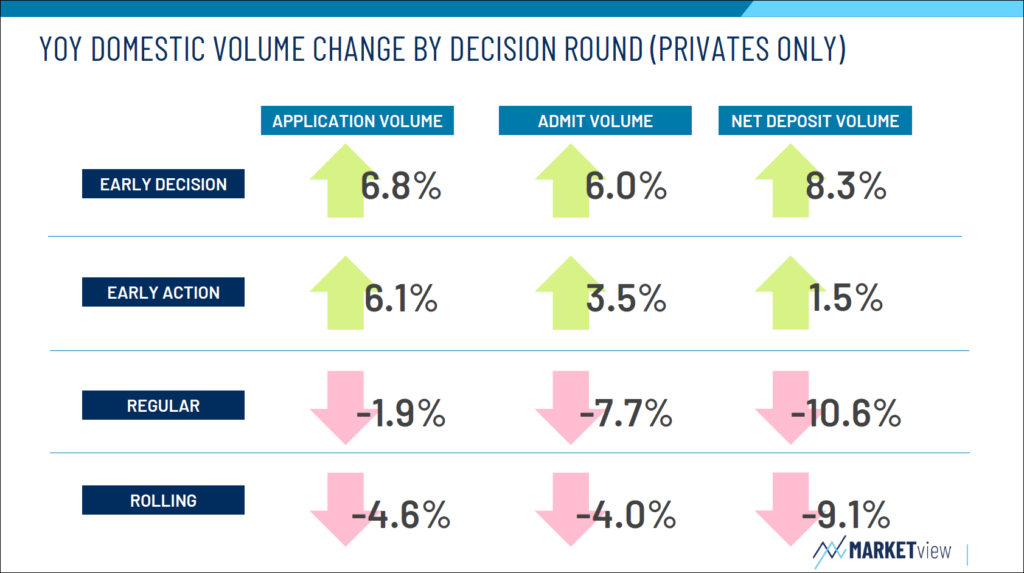
We believe Early Action and Early Decision admits increased at the expense of Regular Decision and Rolling Admits.
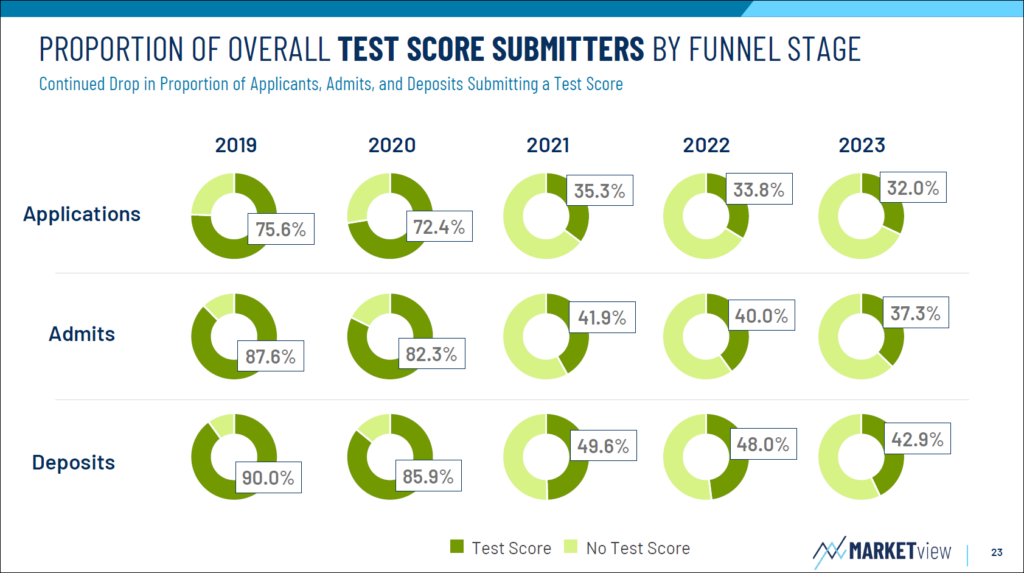
Continued Degradation of Test Score Submitters
(and why it matters)
The graph below shows one of the biggest changes between the pre- and post-COVID eras. In 2019, students were significantly more likely to submit a test score than those who didn’t as test score submitters’ applications (75.6%), admits (87.6%), and deposits (90.0%) far outweighed non-test score submitters.
Today, the opposite is true with test score submitters representing the minority of applications (32.0%), admits (37.3%), and deposits (42.9%).
Test score submissions have consistently trended downward every year since 2019.
Interestingly, it doesn’t matter if schools use test scores in their admissions process or not. Rather, submitting a test score is a behavioral measure that signifies a higher likelihood that a student will commit; students who submit a test score yielded higher (20.4%) than those who did not (16.1%).
In Part 3 of our series, we’ll present insights into international and domestic students and their willingness to travel far from home to attend school.
Wondering how your institution did relative to other schools?
Watch the recording of “The Aftermath of May 1” to discover our eight key takeaways from the 2023 admissions cycle, including a deeper analysis of the trends discussed above.
The Aftermath of May 1:The Biggest Surprises of the Cycle
We discussed all these insights plus cohort-level analysis and additional consumer rating and geographic trends during our May Trends Tuesday webcast (exclusive for MARKETview partners).
Interested in learning how MARKETview can help you reach your enrollment goals like our partners? Connect with us for a short, personalized demo.