
Higher ed’s only comparative, real-time data set
Risk is in what you don’t see.
See beyond the confines of your campus data to make decisions with greater clarity and confidence.

You’re Expected to Hit Your Numbers — Without a Full View of the Market
Most institutions are making high-stakes decisions using only their own data.

Your institutional data tells you what’s happening inside your funnel, but it can’t tell you whether you’re pacing ahead or behind the market. And when you’re expected to hit your numbers, that context matters.
You can’t eliminate the uncertainty of enrollment, but you can see more of what’s shaping it. MARKETview is higher ed’s only aggregated, real-time student data set, giving you a broader view of the enrollment landscape so you can see how you compare and know where to focus.
Data That Doesn’t Exist Anywhere Else.
MARKETview standardizes, aggregates, and de-identifies student records from 200+ partner institutions, updating them daily so you can make real comparisons, not approximations. We then layer in consumer data from virtually every household in the U.S. to give you a more complete view of the market than ever before.

MARKETview Enables You To See Beyond Your Campus
Every institution has data. What sets ours apart is how your class stacks up against the market, how current that comparison is, and whether you’ll get alerted when something shifts.
When You Need Answers Fast, Ask MARK
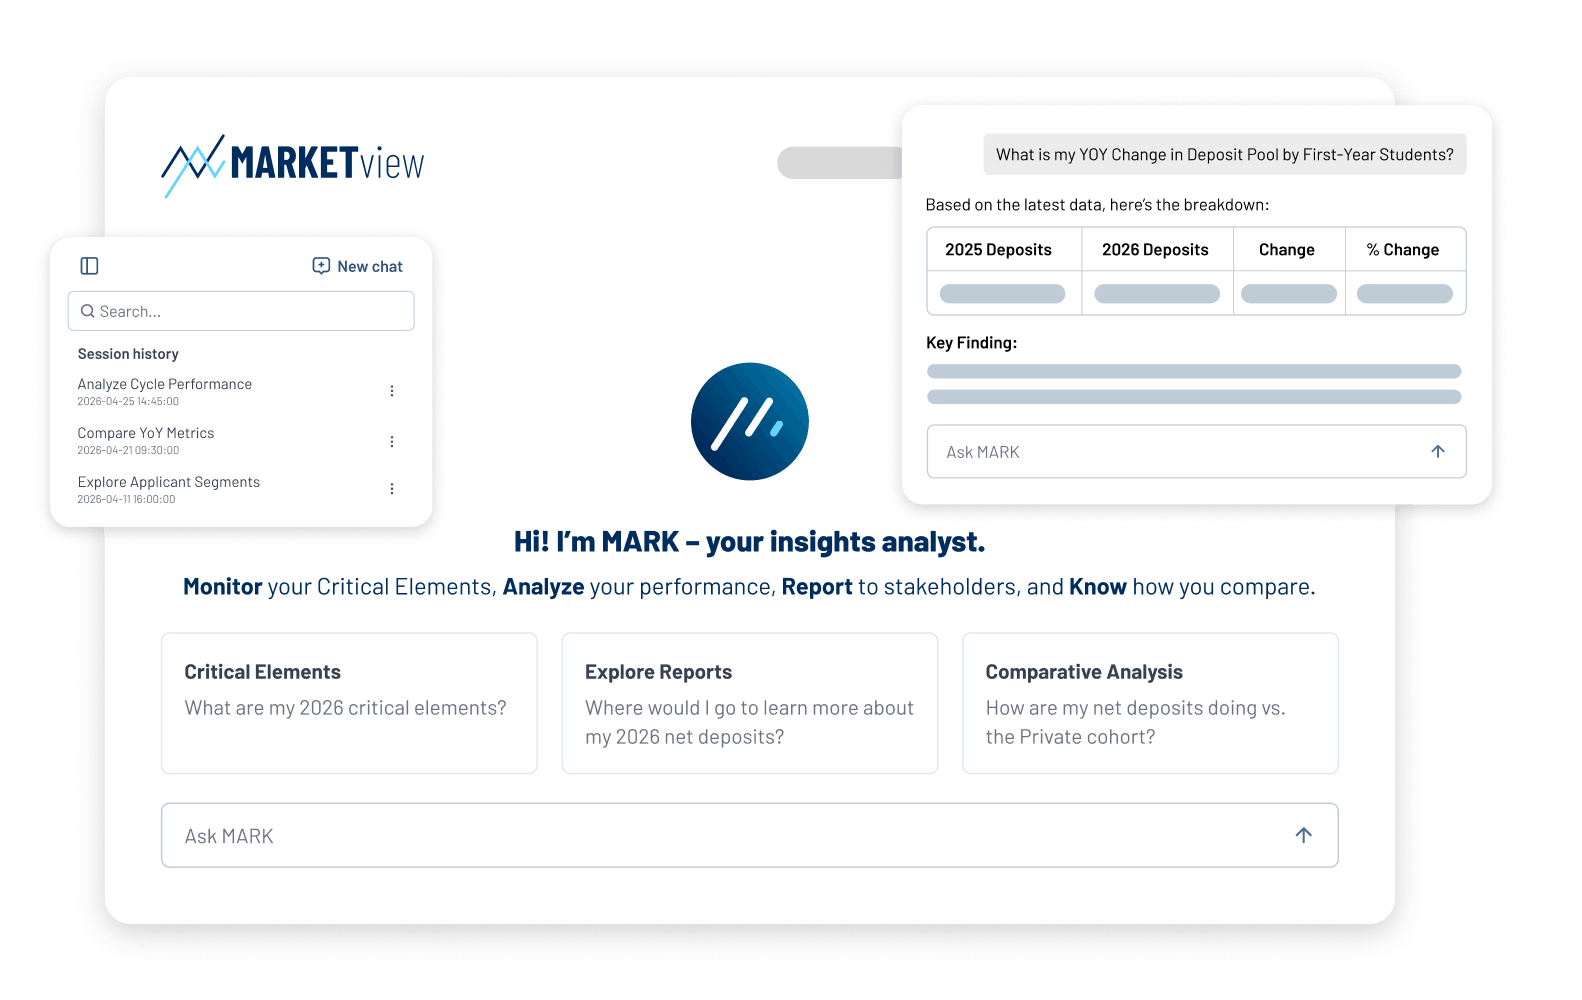
With MARK, MARKETview’s Insights Analyst, you can access our real-time, comparative data set faster and easier than ever. Type in a question and get critical market context in seconds. It’s like having your own data analysis team available 24/7.
MARK Simplifies Your Experience By
- Providing structured explanations, not just raw data
- Helping you conduct deeper analyses inside the platform
- Generating instant charts and visuals to aid stakeholder communications
Just ask MARK — de-identified sample data
How do my 2027 out-of-state inquiries compare, point-in-time, to 2024–2026, and how does that year-over-year change stack up against the Private cohort?
Out-of-State Inquiries at Comparable Cycle Points
2027 compared with the 2024–2026 entering classes
See what MARK found
1 · What MARK found
Out-of-state inquiries for the 2027 entering class came in at 6,810 — a modest pullback from 7,180 in 2025 and 6,940 in 2026, but still ahead of 2024’s 6,410.
2 · How my institution compares
Your 2026-to-2027 decline was just 1.9% — the Private cohort fell 10.6% over the same stretch, nearly 9 points steeper than yours.
3 · Why it matters
A modest dip in raw volume looks very different once you see peers falling much harder over the same period — this points to relative resilience in your out-of-state demand, not an urgent demand problem.
4 · What to do next
This is an outcome metric, not a lever you pull directly — look at out-of-state inquiry-generation channels and follow-up effectiveness to understand what’s driving the relative strength, and protect it.
How has my inquiry-to-application conversion rate changed by source for out-of-state, $100K–$250K household income inquiries over the last three cycles?
Inquiry-to-Application Conversion Rate by Source (2024–2026)
Out-of-State, $100K–$250K household income
See what MARK found
1 · What MARK found
Athletics-driven inquiries saw conversion nearly double, from 7.1% in 2024 to 10.6% in 2026, while your top-performing source, Application, continues to erode slightly — down from 94.1% to 90.7% over the same period.
2 · Why it matters
Emerging traction in a smaller channel like Athletics is worth building on, even as your primary pipeline shows early signs of softening at the very top of the funnel.
3 · What to do next
Invest further in what’s working with Athletics-sourced inquiries, and keep an eye on Application’s slow decline before it compounds.
How is yield tracking for our 300–500 mile Critical Element population, point-in-time compared to last year and to the Private cohort, so I know where counselors should focus this week?
Yield Rate: 300–500 Miles from Campus
Current versus prior entering class, point-in-time
See what MARK found
1 · What MARK found
Yield for your 300–500 mile Critical Element population jumped to 31.2% this cycle, up from 18.4% last year — a 12.8-point improvement.
2 · How my institution compares
The Private cohort barely moved over the same period (14.8% to 14.3%). You now lead the cohort by nearly 17 points in this distance band, up from just a 3.6-point edge last year.
3 · Why it matters
This isn’t just a good year — the gap between you and peers in this population is widening fast, which points to something specific in your approach (messaging, visits, aid positioning) working better than what similar institutions are doing.
4 · What to do next
Use the MARKETview Applicant Score to build a prioritized contact list from the remaining non-deposited students in this population, and get counselors doing personalized outreach while the window is open.
Which inquiry sources are driving the most applications, and how well do they actually convert to enrolled students?
Application Yield by Inquiry Source
Current entry term
See what MARK found
1 · What MARK found
Application Materials and Application drive 70.0% of all applications combined, but among sources with any real volume, they convert at some of the lowest rates — just 22.1% and 9.6%. Visit, a smaller but still substantial source, actually outperforms both at 37.0%.
2 · Why it matters
The channels doing the heavy lifting on application volume aren’t the ones bringing in students who ultimately enroll. Visit is both sizeable and higher-yielding than your two biggest sources — and it’s the one your team can directly scale through staffing and visit-day capacity.
3 · What to do next
Model what expanding visit capacity could do given its above-average yield, and dig into why Application and Application Materials-sourced applicants enroll at such low rates relative to the rest of the mix.
Our board wants us to expand beyond our core market next year — how concentrated are we compared to peer institutions, and what should I bring to my next board update?
Net Deposits by College Board Region
You versus the Private cohort
See what MARK found
1 · What MARK found
Broken out by College Board region, 63.0% of your net deposits come from the Midwest — compared to just 16.0% for the Private cohort. Your class draws from one region far more than peers.
2 · How my institution compares
The cohort’s single biggest region, Middle States, makes up over a quarter of their deposits — but under 3% of yours. Western and Southern markets are also underrepresented versus peers.
3 · Why it matters
Many private institutions work to reduce this kind of regional concentration to build a more stable, national base. Heavy reliance on one region leaves you exposed if that market softens.
4 · What to do next
Prioritize tailored outreach, marketing, and aid strategy in the Middle States, Western, and Southern markets, where the cohort already draws strong volume and you barely register.
Questions We Get From Enrollment Leaders

Where does the data come from?
From our partner institutions. Each contributes student-record-level enrollment data, which we standardize and de-identify so it can be compared across institutions. That aggregation of more than 200 colleges and universities and their student records is what lets you see behavior no single institution could observe on its own, and it is augmented with consumer data covering more than 130M U.S. households.
Is my institution’s data shared or identifiable?
No individual institution’s data is presented, in the aggregate or at the student level, to any other school. Each partner only sees their own data and cohort data in the aggregate. Cohorts are designed to prevent any single school from being observed or observable. Additionally, student names are 100% de-identified for comparative analysis. Our corporate policies and information security practices receive independent third-party validation each year under SOC 2 Type II. We are also TX-RAMP Level 2 certified, and we do not train an AI model on your data.
How is this different from our CRM, or from public benchmarks?
Your CRM is the authority on your own funnel and tells you nothing about the market. Public data and generic benchmarks arrive late, aggregate away the populations you care about, and cannot tell you whether a change this week is yours or everyone’s. MARKETview is organized at the student-record level, refreshed daily, and compared against peer and aspirant cohorts, not an average of averages.
Is MARK a chatbot?
No. MARK is MARKETview’s Insights Analyst. You type a question in plain language and get structured explanations grounded in our real-time comparative data set, plus help conducting deeper analysis inside the platform. It’s a faster route to the intelligence you already have. AI is the mechanism; the data underneath is the advantage.
How long does implementation take?
New MARKETview partners typically see their data live in platform in a matter of weeks.
Who do you work with?
Traditional nonprofit four-year colleges and universities in the United States. Our primary partner is usually the vice president for enrollment management, working alongside presidents, admissions and financial aid leaders, institutional research, marketing, and finance.
What does it cost?
Pricing depends on scope: which product views you need, and whether financial aid or marketing services are included.