
As the next enrollment cycle continues to gain momentum, we’re able to see early insights for Application Starters, that is, students that start the application process as their first demonstrated interest in a school.
In MARKETview, these students fall into the “Application Materials” inquiry source. For the 2023 entering cohort, this group of students represents 11% of total inquiries and has grown by 49% in volume since 2021.
This is a compelling group, making up 20% of all applicants, 17% of all admits, and 14% of all 2023 net deposits to date.
So why do only 35% of these application starters end up completing and submitting an application? And, how can you move the dial on YOUR starters? We thought these questions deserved a bit more context.
To gain a better understanding of where these students are coming from, we did a deep dive into the thousands of different source labels used to capture students in the “Application Materials” population in MARKETview. Despite the volume, we were encouraged to find a tremendous level of consistency in data definitions. That allowed us to segment the population into seven distinct categories.
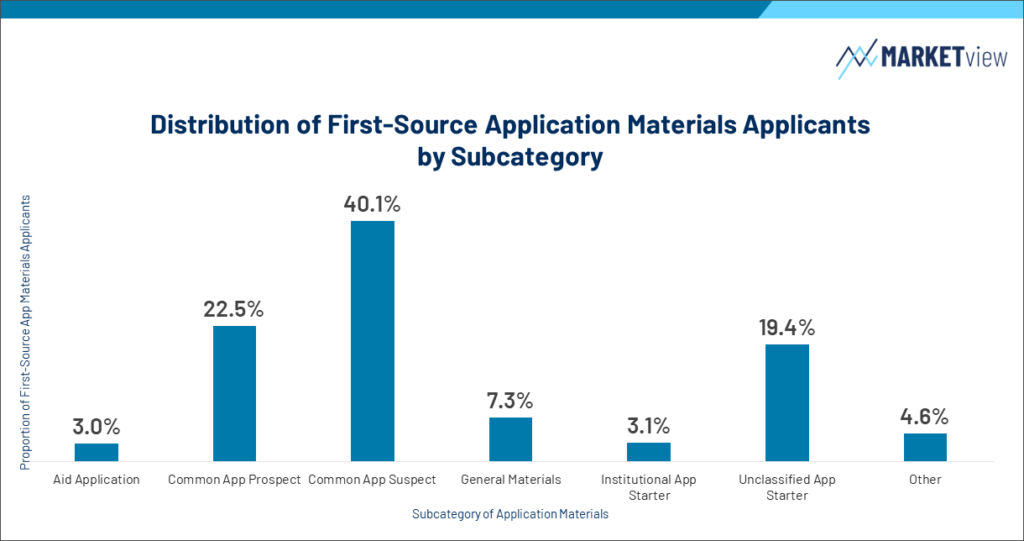
We have defined the categories and measured the distribution of application materials inquiry sources as follows:
- (2.96%) Aid Application – The student submitted either a FAFSA, Profile, Institutional Scholarship, or Aid Application.
- (22.54%) Common App Prospects – Data labels clearly differentiated that the student made it to the “Prospect” phase (selecting an application term and type, in addition to adding the school to the list of “My Colleges”) before being imported by the institution for the first time.
- (40.09%) Common App Suspect – Data labels clearly differentiated that the student was a “Suspect” at the time of ingestion by the institution.
- (7.27%) General Materials – The student submitted any supporting credentials. There were a lot of school-specific terms in this group, but the population reflects any student whose record was converted to an inquiry status based on having submitted various items including essays, transcripts, etc.
- (3.11%) Institutional App Starter – These students begin their application process by starting a campus-specific application. It is important to note that their application rates reflect them submitting any application for admission even if it ultimately took place on the Common, Coalition, or state-specific (Texas) platform.
- (19.44%) Unclassified Starter – This group of students falls into a broader bucket based on less specificity in the codes used to define just how far the students went in creating their accounts before submitting. A large portion of this population is students on the Coalition platform who are most often identified by some variation of “Coalition Application Created.” This population also reflects some Common App sourced students where there was no differentiation between the Suspect or Prospect status.
- (4.58%) Other – This share of the population reflects a small collection of tremendously nuanced, remarkably diverse source codes. These are application starters or material submitters by institutional definitions but reflect a wide spectrum of campus-specific strategies and practices. As seen in their relative conversion rates, it would introduce ambiguity in the performance of other segments to try and shoehorn this population elsewhere.
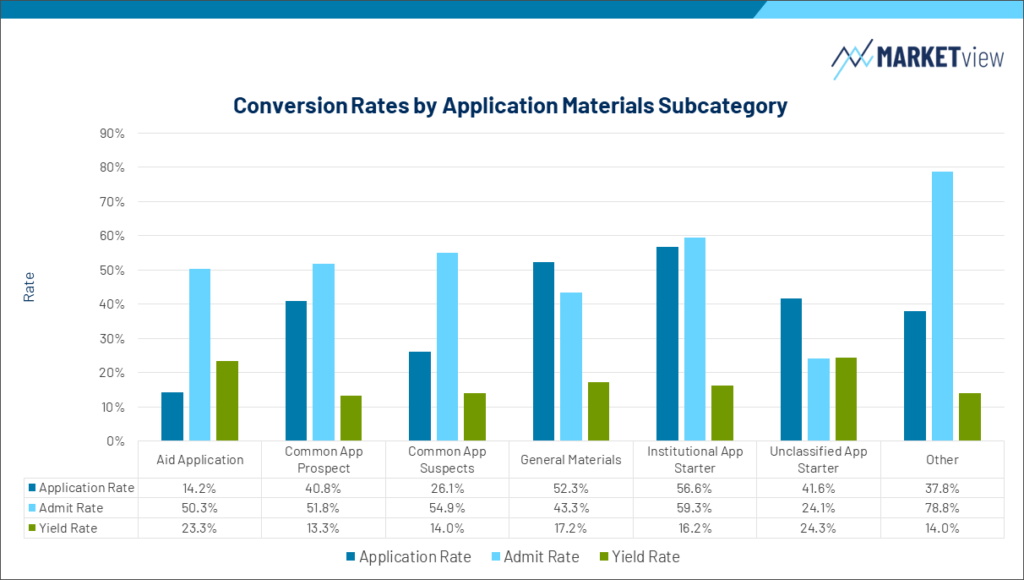
Compelling as the compositional distribution of these sources may be, the real story emerges when examining each source’s respective conversion rates. The application materials inquiry source alone made up 14% of the Fall 2023 enrolled cohort.
As the fall 2024 application season accelerates, some potential questions emerge. Having spent quite a bit of time in the nitty-gritty of these sources, I invite you all to consider where there may be some opportunity for more specific strategy and segmentation on your campus.
By looking at the wildly different application, admit, and yield rates across these subpopulations some observations and questions arise:
- How are you segmenting your various application starters and how does their funnel performance compare to what the MARKETview data reveals? Are you confident that you are leveraging this data to its fullest extent in your senior campaigns?
- For our MARKETview users, this is a great population to evaluate relative to their consumer groups and estimated household income. In looking at the composition of app starters who did not complete and submit an application last year, there may be an opportunity to tailor specific messages about affordability, merit, or application fees to this population in a way that could move the dial.
- If you are not tagging your application account creators in a way that recognizes their starter status (suspect, prospect, etc.) the data would suggest an opportunity exists to get to this additional level of granularity. That “Unclassified Starter” group could potentially reveal additional insights if segmented more specifically.
- While the Aid Application sub-source represents a relatively small proportion of the population, the application conversion rate stands out at (14.2%). This is more of a campus operation question but if this practice is particularly taxing from a data exchange standpoint, it may be worth revisiting.
- At the opposite end of the spectrum lies the Institutional Application. Of course, the student that has you higher on their list will want to put in the effort to complete YOUR application. However, if you are not currently supporting an Institutional Application, is that a decision that might deserve reevaluation in the nearly universal test-optional, post-SCOTUS, pre-College Board Connections age? Is there behavioral intelligence you can leverage via an Institutional Application that might help you reach those critical admit rate and yield goals?
Interested in learning how MARKETview can help you reach your goals?
