
While the move toward test optional admissions policies was already gaining traction at many colleges and universities prior to 2020, the pandemic ultimately put mass adoption into high gear. At MARKETview, we have compiled data across the past five years to show how students who submitted a score and those who did not differed at various stages of the enrollment funnel over time.
As your institution plans future recruitment efforts, here are a few findings that you may find most insightful in achieving your enrollment and financial goals. We will start with a wide-lens view of the market at large and then zoom-in on more discrete audiences. This is what the big picture looks like:
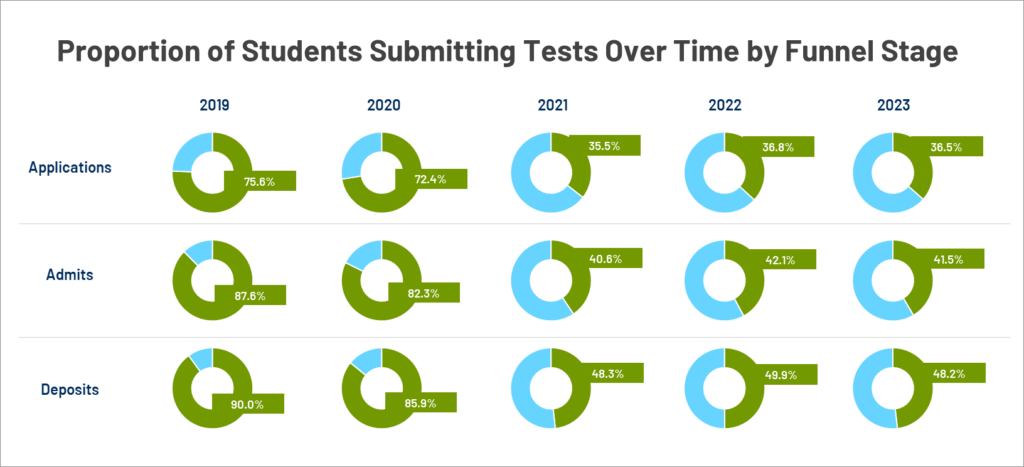
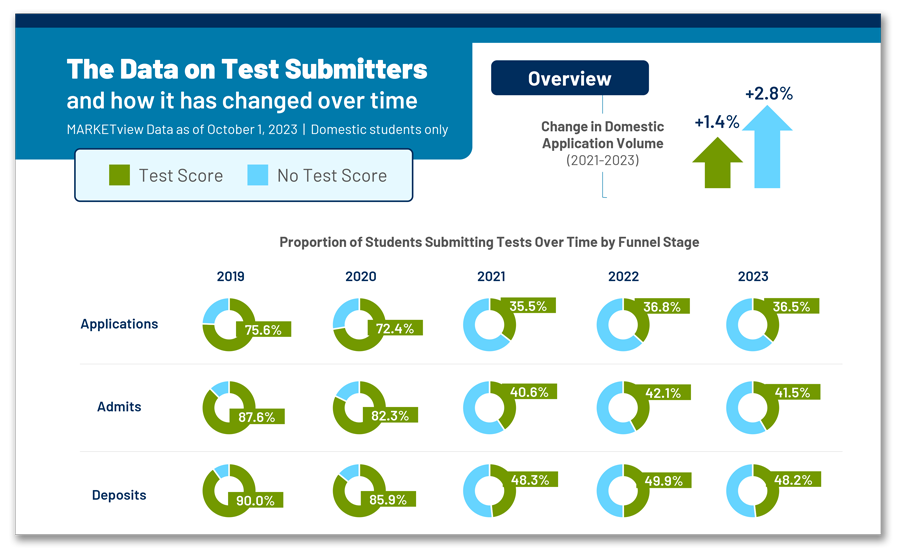
Overview
Precipitous drops in submission from 2020 to 2021 are not surprising, but a leveling off in submissions (followed by a slight dip) from 2021 to 2023 indicates continued uncertainty for the foreseeable future.
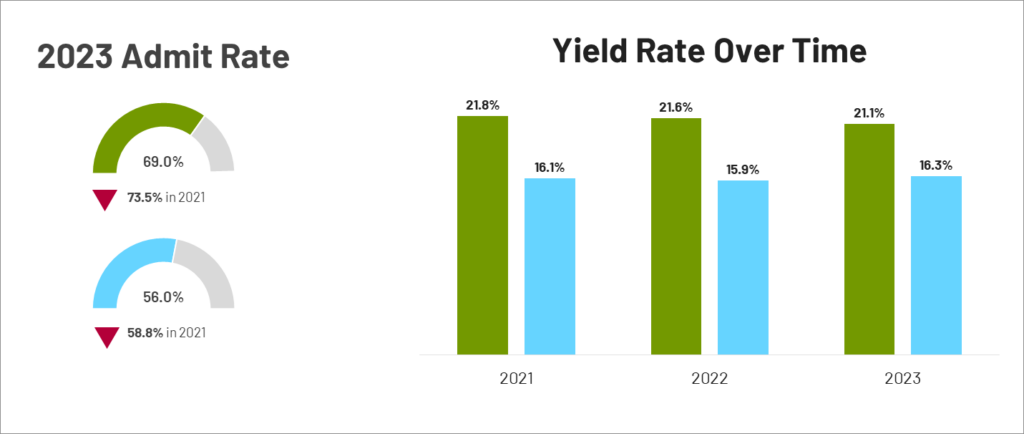
Specific breakouts of Admit and Yield rates for the past three years indicate that students who submit a test score tend to be admitted at higher rates:
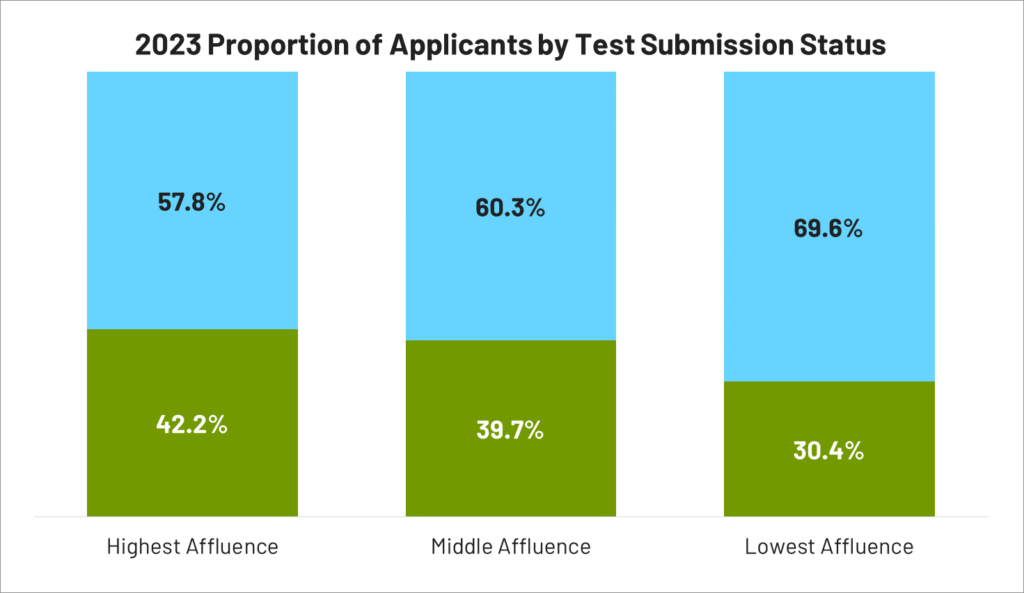
Affluency
MARKETview’s global data set, made up of millions upon millions of student records and household-level consumer data, confirms that the least wealthy student populations are much less likely to submit scores – making that important group even more difficult to identify, engage, and qualify:
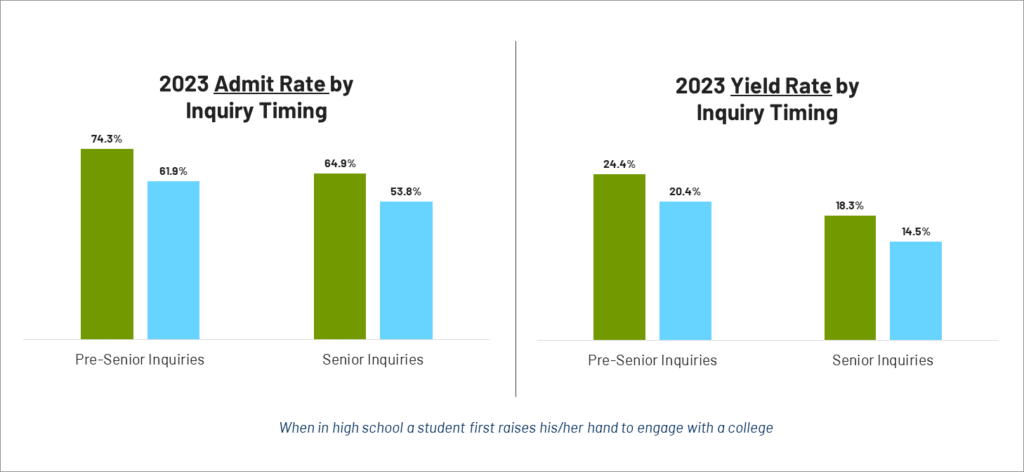
Inquiry Timing
47.3% of students who begin engaging with colleges prior to their senior year of high school (Pre-Senior Inquiries) submit a test score compared to only 31.3% of students who wait to engage in their senior year (Senior Inquiries).
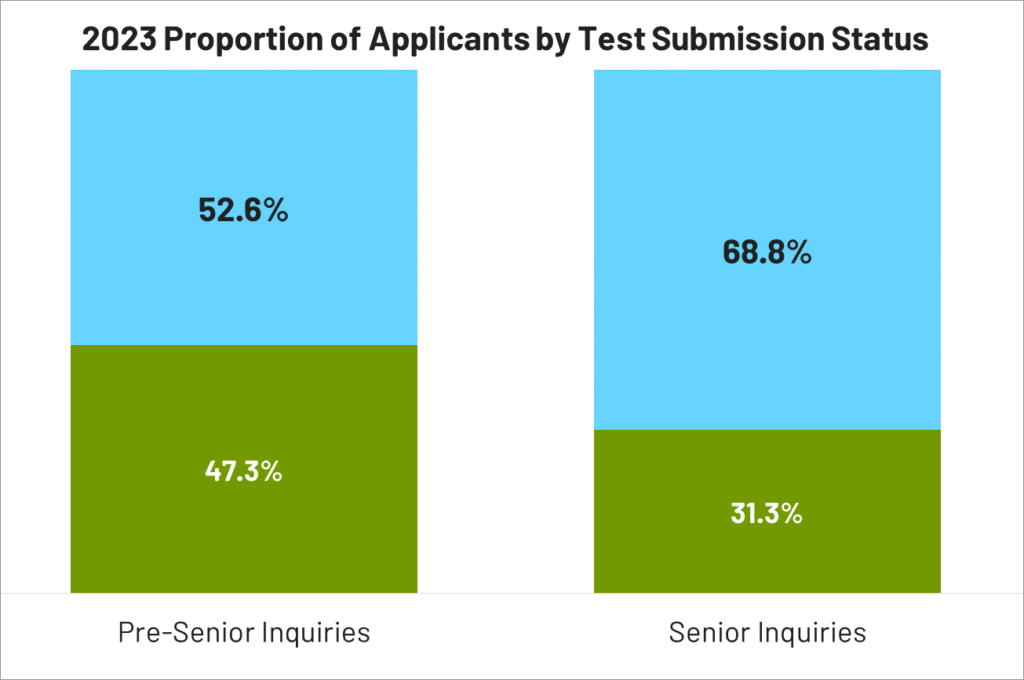
Admit and Yield Rates also vary dramatically based on when a student engages. For example, pre-Senior Inquiries are admitted and yield at higher rates overall, but those rates increase even more when a student also submits a test score.
Just as other major disruptors in higher ed including the affirmative action ruling, College Board changes to sophomore/junior search, and updates to FAFSA will impact your ability to achieve your enrollment goals, so too will the decisions your institution makes around its test optional policy.
The Data on Test Submitters (and how it has changed over time)
Want more insights? Simply download MARKETview’s Test-Optional Infographic for additional data on:
– How admit and yield rates compare for nationally ranked institutions
– The proportion of applicants submitting test scores by academic interest
– Test-score submission rates by gender and ethnicity
We hope this data provides you with helpful context for establishing a successful path for achieving your objectives.