
With just over a week until May 1, all eyes are on deposits and yield.
Although the market has not fully recovered from the pandemic, trends are beginning to normalize since the outlier that was 2020. We’ve identified a few notable, high-level trends to help you plan for the final days leading up to May 1:
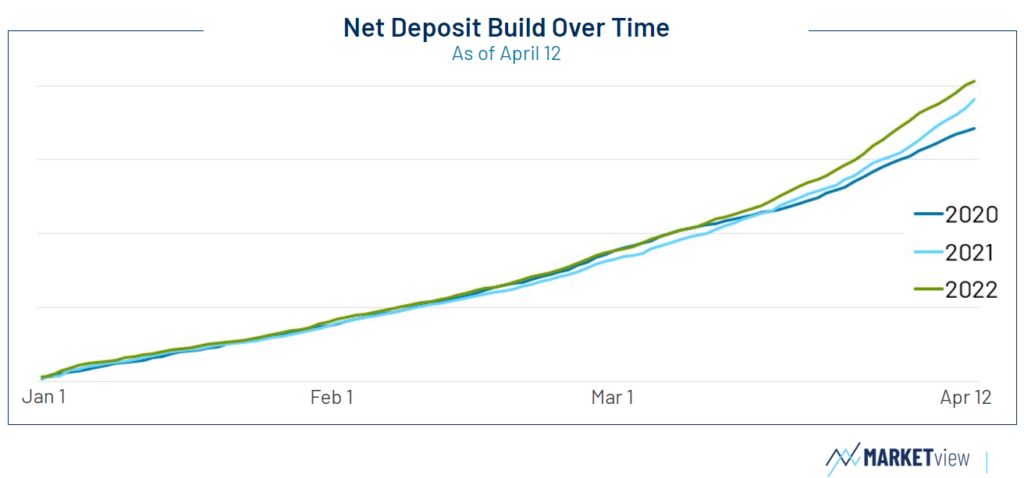
As testament to the resilience of the market, 2022’s point-in-time net deposits outpace 2021’s … just as 2021’s outpaced 2020’s. There’s still some time before we return to pre-pandemic levels, but it’s encouraging to see this consistently positive trend.
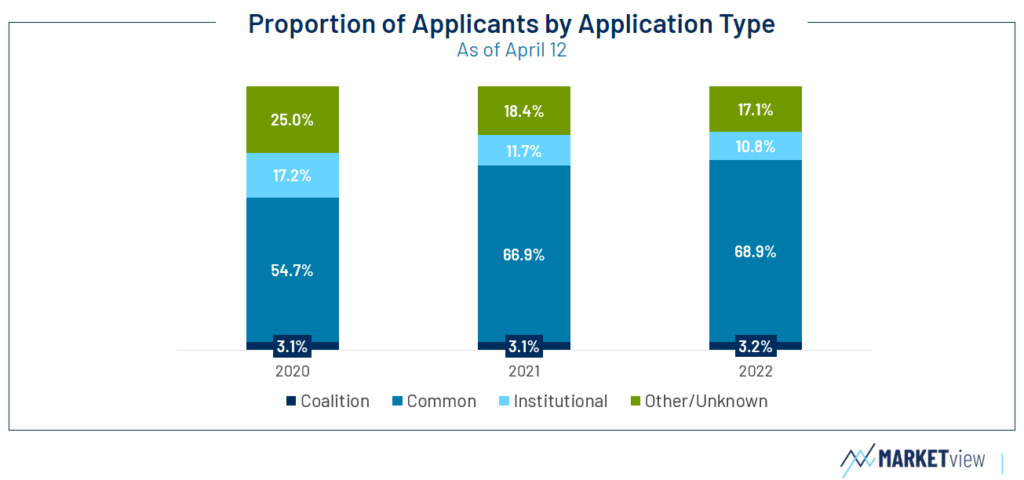
Common App influence continues to grow as institutional application volume falls. But does that mean institutional apps have lost their place in the market? Not necessarily. Students who fill out institutional applications are more likely to yield (currently around 22 percent) than those who apply with the Common App (currently yielding at 8.9 percent).
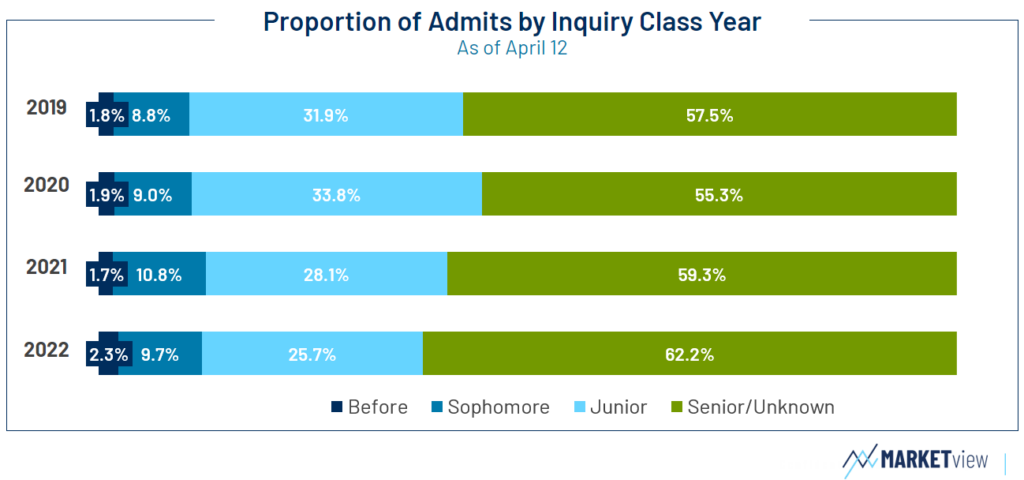
It’s important to address students who became inquiries as sophomores and juniors differently than those who became inquiries as seniors – and this year’s cycle has more senior-originated inquiries than ever before. These students yield less productively (at around 9.7 percent) than those who originate in earlier years (currently at 16 percent).
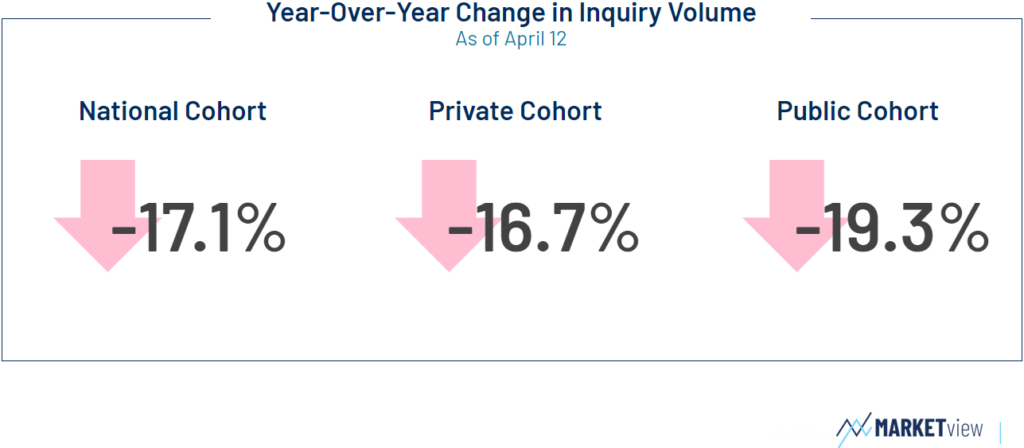
Unfortunately, year-over-year inquiry volume remains down across all cohorts – one pandemic trend that has not yet righted course. However, there’s still time to engage current sophomores and juniors, and some intentional messaging and activities can help combat these trends. Ensure you’re doing all you can to keep this smaller pool of students interested and engaged.
If you’d like to learn (much) more about these trends and to discuss where to go from here – even for just 15 minutes – let us know. We’d also love to help you plan for the coming years. Share your goals and which data points are most pertinent, and we’ll tailor the conversation to be as helpful as possible.
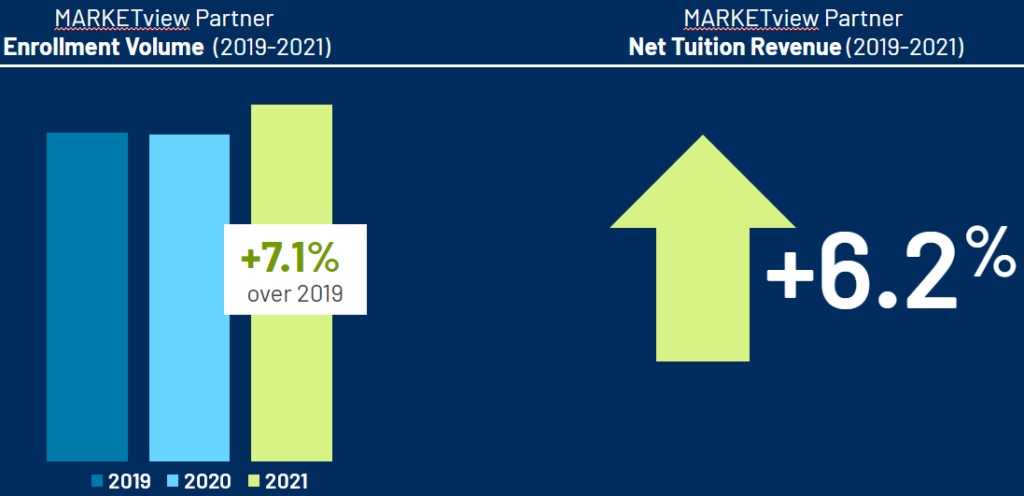
We work in close consultation with our partners to ensure they meet their specific goals. Since our partnerships began in 2019, our partners have seen a 7.1 percent increase in overall enrollment volume and a 6.2 percent increase in their net tuition revenue.
We’re proud of these statistics – especially amidst the pandemic-related challenges – and we’re excited to continue helping our partners meet their goals.