
With the new year in full swing, now is the perfect time to explore the latest admit data for MARKETview’s private cohort. To give you the most fulsome view, we’ll review data as of January 5, 2024, and break out the results by Early Decision and Early Action perspectives.
As always, we look forward to keeping you updated on the most recent trends via timely data and expert analysis. Let’s get started!
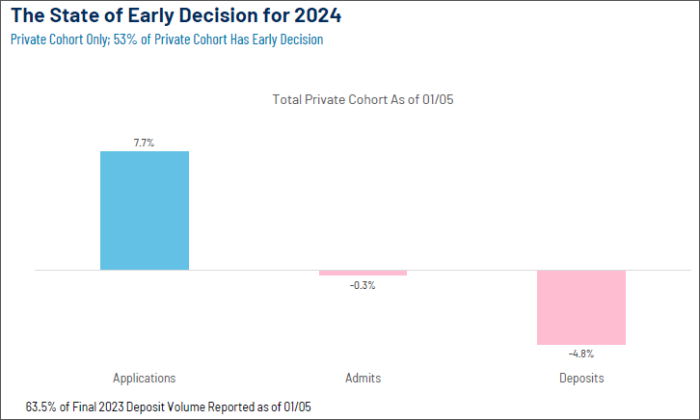
A Big-Picture Look at Early Decision
Where We Are at Three Key Stages
For schools that have ED, overall applications were up 7.7% compared to 2023 while admit activity was slightly down -0.3%. Of note, for 2023, over 63% of deposits were in at this point – a discrepancy likely due to the FAFSA delay, and something we’ll be sure to monitor as these very-early results begin to mature.
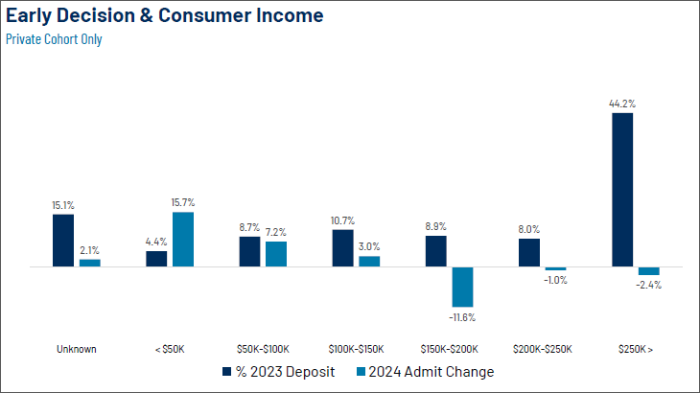
Behaviors at Different Income Levels
When we broke the data out by income bands, we saw that the only declines within the admit pools are occurring at the highest income levels. This will be an important early indicator to keep an eye on as these more affluent segments accounted for upwards of 65% of ED deposits last year.
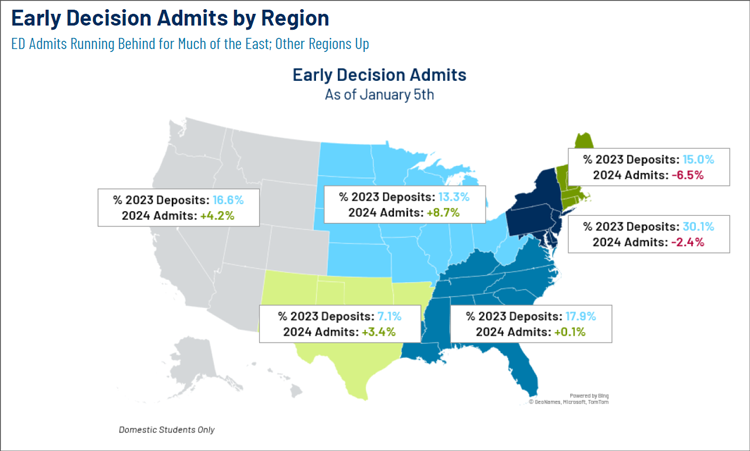
How Different Regions Are Tracking in Admits
From a geographic perspective, the largest declines in admits were in New England and the Middle States while all other regions showed solid gains. Once again, though, it’s still too early to draw any firm conclusions from this developing story.
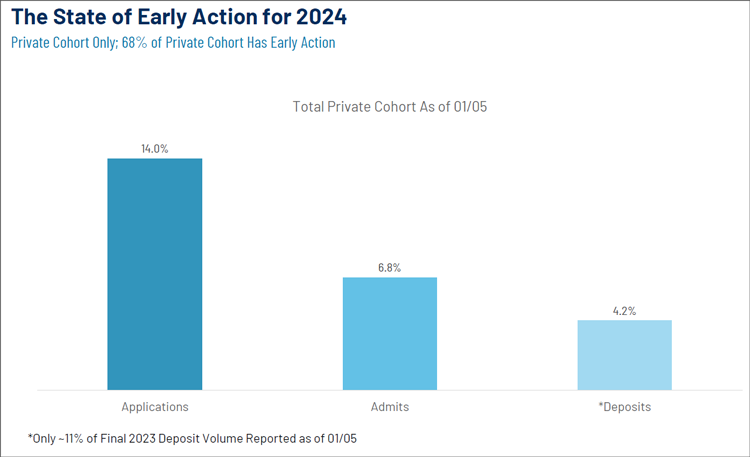
A Big-Picture Look at Early Action
Where We Are at Three Key Stages
For schools that have EA, all of the key metrics (applications, admits, and deposits) were up compared to the prior year. For benchmarking purposes, it’s important to know that only 11% of final EA 2023 deposit volume had been reported as of this point in 2023, so stay tuned for updates in this vital area.
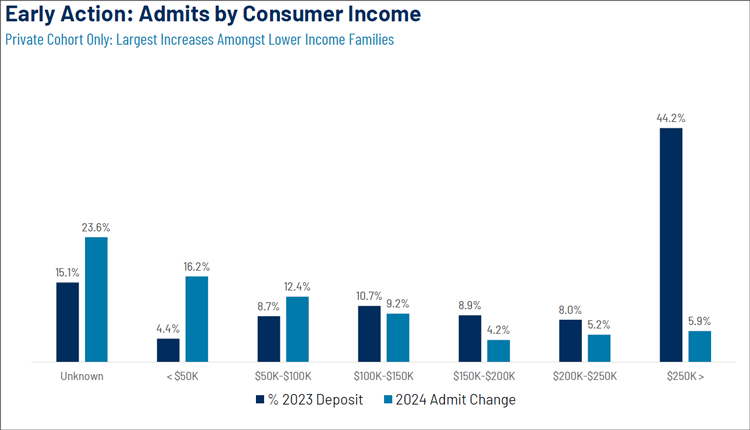
Behaviors at Different Income Levels
Two emerging stories here: 1) Similar to ED, we saw the preponderance of the admit increase in the lower- and middle-income bands; 2) Unlike ED, though, we saw the admit increase continue through to the higher end of the income range.
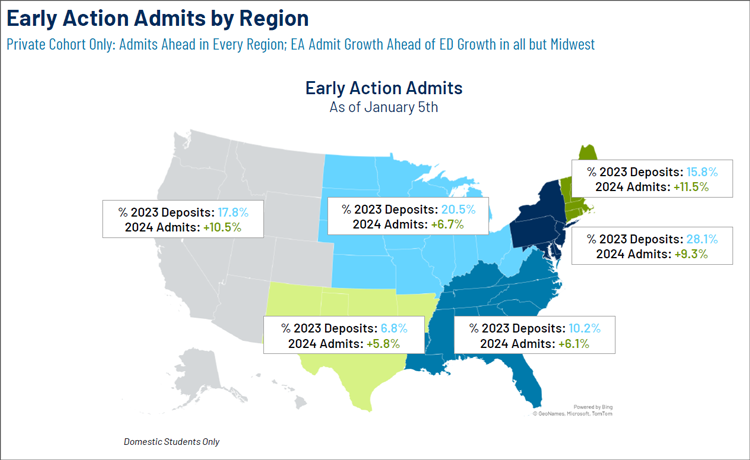
How Different Regions Are Tracking in Admits
For EA, all regions have shown a lift in admits. And every region except for the Midwest displayed greater gains than ED. While we don’t want to sound like a broken record, it bears repeating that all of the data we’ve shown is still very much far from final. We look forward to sharing the rest of this important story as it unfolds.
Thank you so much for checking out this early view of admit activity. Please be on the lookout for future updates from MARKETview in the days and weeks ahead.
If you would like to discuss any of this material more in depth, or if you have any questions about how to build the class you most desire, feel free to contact us for a friendly data-informed conversation.
24 Trends for Entering Class ’24: Key Insights You Need to Know
Kick off the new year with an in-depth look at how the Entering Class of 2024 is shaping up. We’ll share 24 key insights from the MARKETview data set of more than 130 institutions nationwide on the performance of this year’s admissions cycle thus far.
Register Today