
As colleges and universities wrap up the Entering Class of 2023 and shift their focus to the Entering Class of 2024, part of that focus is innately on financial aid policy. What worked last year? What didn’t? But an even bigger question we know our partners get asked about from their campus stakeholders is, “What happened among other schools?” Historically, enrollment leaders must wait an entire year to get that data from IPEDs—much too late to inform any potential changes to their financial aid policy for the upcoming cycle or to help educate campus partners on what it means to set attainable financial aid and enrollment goals.
With the release of MARKETview’s Comparative Aid report, partners can understand what happened this year when it comes to trends in the market for institutional aid, discount rate, and net tuition revenue among key populations.
Here are four key findings from our data as of August 5, 2023:
Webinar: The Reinvention of Financial Aid
This pre-recorded webinar provides exclusive insight and tips on how to prepare for these upcoming financial aid changes with confidence.
Key Finding Number 1: Average Net Tuition Revenue Per Student Has Remained Steady Over the Last Three Years

Average institutional aid awarded to students in 2023 increased by 1.5%, discount rate increased by .4 percentage points but the average net tuition revenue remained flat. As partners increased tuition and fees from the previous years, the average institutional aid awarded also increased to accommodate those changes. This resulted in net tuition revenue remaining flat. When thinking about setting net tuition revenue goals, it is important to have this base in mind to help level-set expectations for net tuition revenue per student.
Key Finding Number 2: Net Tuition Revenue from Local Students Remained Flat, While Net Tuition Revenue from Students Further from Campus Increased—But Deposit Metrics Matter
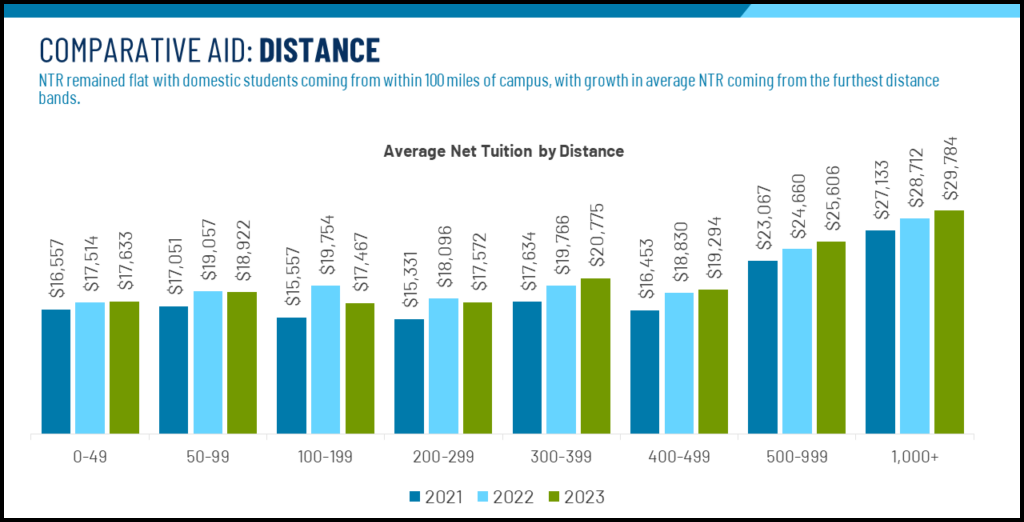
When it comes to owning your backyard, students within 100 miles of campus historically bring in less net tuition revenue than those further from campus. Over the last two years, the average NTR from students coming from within 100 miles has remained steady between $17,500-$19,000 and did not increase in 2023. The international population and out-of-state tuition among public schools played a role in a 3.8% increase in average NTR from students living 500-999 miles from campus, and a 3.7% increase in average NTR from students coming 1000+ miles from campus.
Understanding deposit trends among these populations, though, offers additional insight. There was a 5% growth in deposits from students living within 50 miles of campus compared to a 3.7% loss in deposits coming from students living 500-999 miles from campus, and a 6.2% loss in deposits coming from students living 1000+ miles from campus.
Even though local students brought in less average NTR per student than further-from-campus students, this is where we observed enrollment growth for the entering Class of 2023. While there is an opportunity to bring in more NTR from students further from campus, it’s important to understand the deposit behavior of these students.
Key Finding Number 3: Average NTR From All Consumer Income Bands Remained Flat and Deposits Dropped from Middle-Income Families
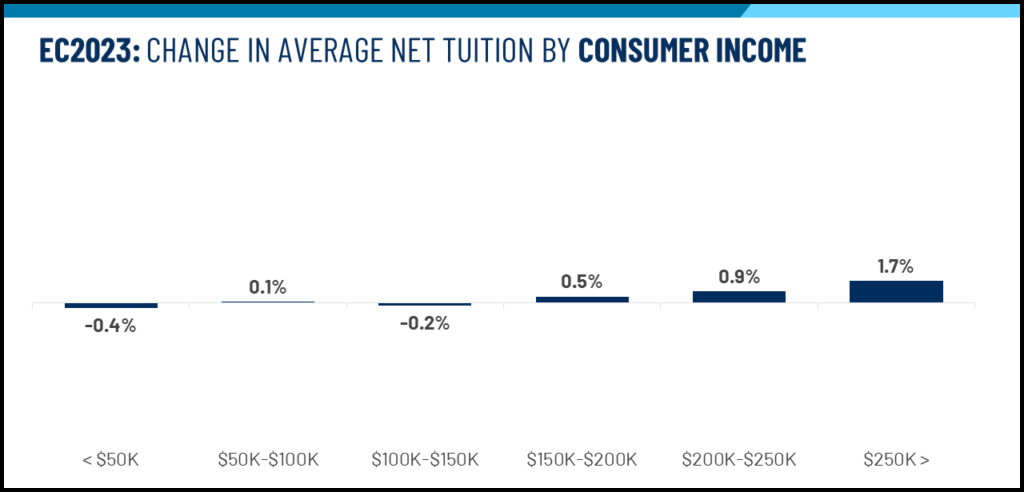
When looking through the lens of consumer income, the market brought in average NTR across each consumer income band the way we would expect it to: families making less than $50,000 annual income providing less NTR per student than families making more than $250,000. However, there was no significant increase in average NTR across any consumer income band in 2023. While it is reasonable to expect to collect more average NTR from families who have the ability to pay than those who have a lower estimated income, knowing that increase was only at 1.7% is another reminder that a family’s ability to pay isn’t the same thing as their willingness to pay.
Where we saw significant change was at the deposit level. Average NTR among all consumer bands remained relatively flat compared to last year, but deposits did not. There was a 4.4% loss in deposits from families making $150,000 – $200,00 annually and a 3.3% loss from families making $200,000-$250,000 annually. Many of these families fall into the category of being too wealthy to qualify for financial assistance but are not able to write a check for the EFCs they appear to have. This group continues to feel the pinch—something to keep in mind when thinking about aid policies heading into the 2024 cycle.
Key Finding Number 4: Deposits Among Black and Hispanic Students Increased, But It Comes with Average Net Tuition Revenue Losses

With many colleges and universities looking to increase enrollment from students of color, understanding the financial implications of that can be helpful when setting both enrollment and financial aid targets. In 2023, we saw an 8.1% deposit increase among Black/African American students, a 5.8% increase in deposits from Hispanic students and a small loss (-0.5%) in deposits among Asian students. The market was able to enroll the Black and Hispanic populations in a significant way, but it did mean additional institutional investment.
From an average NTR standpoint, the market saw a -1.2% loss from Black/African American students, a -7.8% loss from Hispanic students, and a -9.9% loss from Asian students. Setting headcount growth goals from an ethnicity lens is attainable, but schools must recognize that these populations may require additional institutional investment to hit those enrollment goals.
Looking Forward
Following the release of MARKETview’s Comparative Aid report, we will be periodically sharing insights on financial aid trends throughout the cycle on our blog.
Subscribe to our newsletter for additional updates or connect with us to learn more about our Comparative Aid Report.