How does urbanicity (the degree to which a geographical area is considered urban) affect college choice? That was the question MARKETview set out to answer based on application and yield rates from our partners nationwide.
For this study, we used the following urbanicity categories:
- Rural – Low-density areas, including towns and suburbs on the exurban fringe
- Suburban – Moderately dense neighborhoods by metro or city cores
- Metro – Moderate- to high-density sectors, representing major population centers
Because the Suburban audience has generous overlap with the other two urbanicities, we focused most of our attention on deriving comparisons between the more contrasting Metro and Rural audiences. We did, though, show the Metro and Rural students’ affinity for Suburban schools. For reference ~35% of enrolled students in our data are Rural students and ~24% are Metro students.
The following is a selection of six key findings:
Urbanicity in the Application Stage
1. Students Display No Preference For Home Urbanicity in the Application Stage
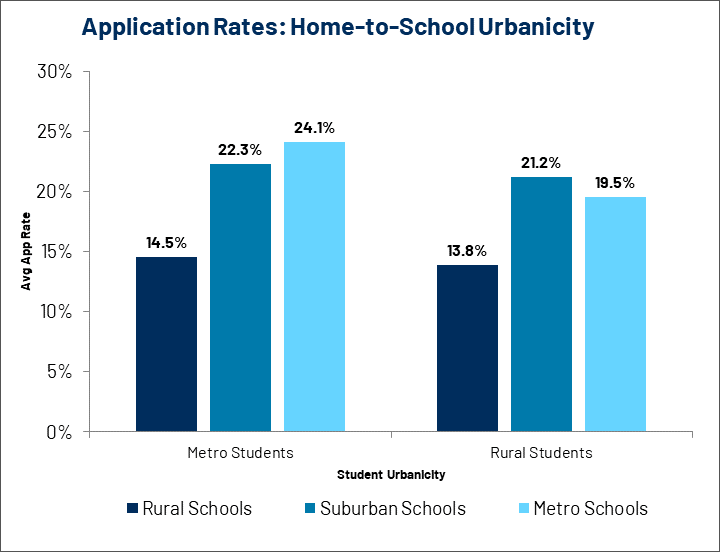
When applying, it appears that all students are open to considering a wide range of urbanicities. However, both groups applied to Rural schools at a much lower rate, and Rural students showed a slight preference for Suburban schools (21.2%) over Metro institutions (19.5%).
2. Application Rates Higher Towards Metro Schools Regardless of Selectivity
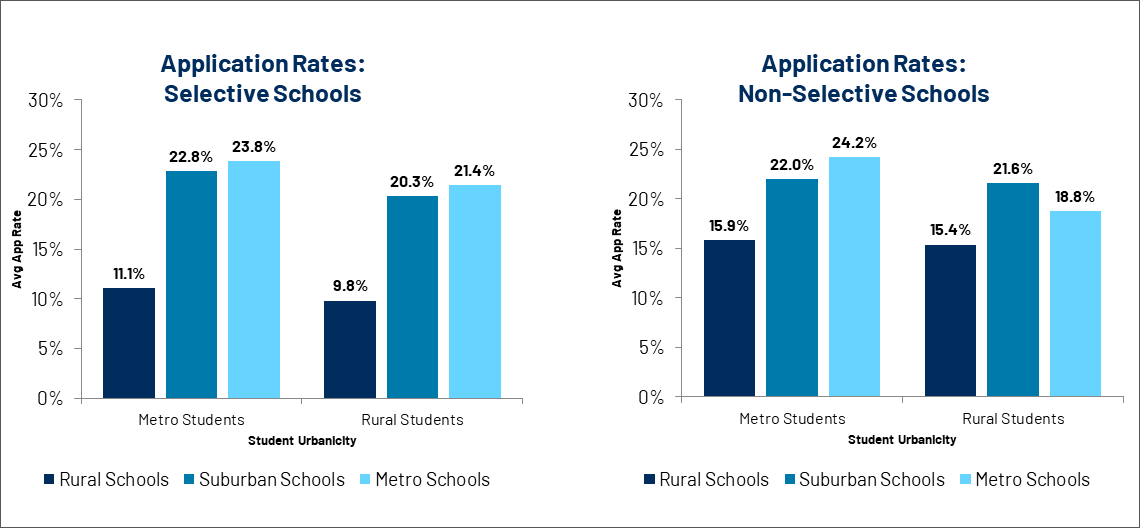
Looking at the application rates for Metro and Rural students through a selectivity lens reveals that both apply to Metro schools at a higher rate than Rural schools. When comparing non-selective schools, Rural students’ application rates at suburban schools (21.6%)—edge out metro schools (18.8%) and rural schools (15.4%), alike.
The differences in application rates are actually larger when comparing selective schools in rural vs. metro settings, suggesting selectivity isn’t enough of a draw regardless of a student’s home urbanicity to consider a school in a rural setting.
Urbanicity in the Yield Stage
3. Rural Students Exhibit a Preference For Rural Schools at the Yield Stage
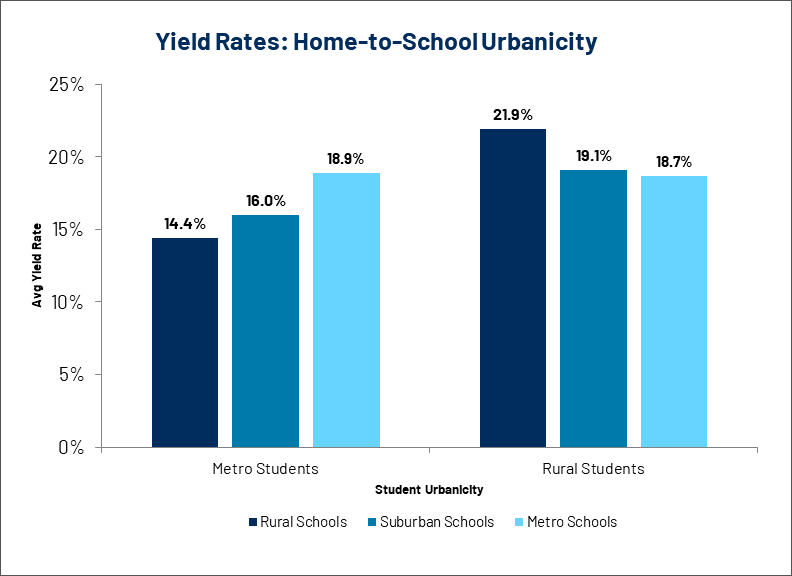
Switching to yield, we see a complete inverse in preferences between the two groups. You’ll also notice that the highest yield rates are seen among Rural students choosing Rural schools (21.9%), which is quite different from their behavior pattern at the application stage.
It’s also worth pointing out that the Rural student yield at Metro schools (18.7%) is roughly the same rate as the yield for Metro students at Metro schools (18.9%). This shows the importance of both institution types staying persistent in their pursuit of students from Rural locales.
4. Rural Preference For Home Urbanicity Not Evident in Yield to Selective Schools
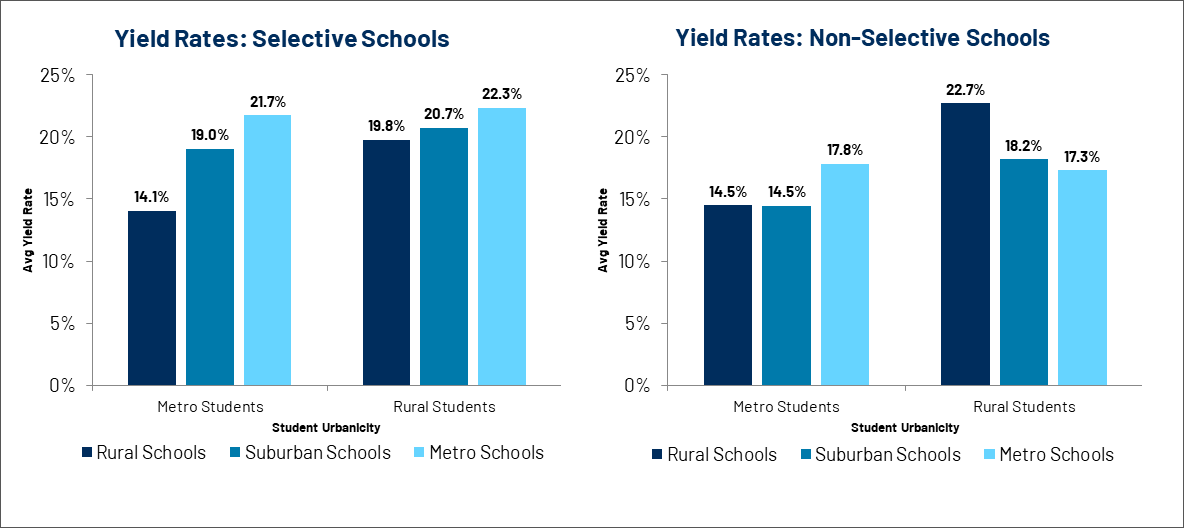
When it comes to yield rates at Selective schools, both Metro and Rural demographics behave similarly, including both having a strong leaning toward Metro schools. Looking at Non-Selective schools, however, we see Rural students strongly favoring Rural schools (22.7%) and Metro students exhibiting a penchant for Metro institutions (17.8%).
From the graphs in this section, we see that home urbanicity does, in fact, have a strong impact at yield stage.
Willingness to Travel Based on Selectivity
5. Students Travel Farther to Enroll at Selective Schools, Regardless of Urbanicity
In the final two graphs, we’ll investigate disparities in how far students are willing to travel to both Selective and Non-Selective institutions.
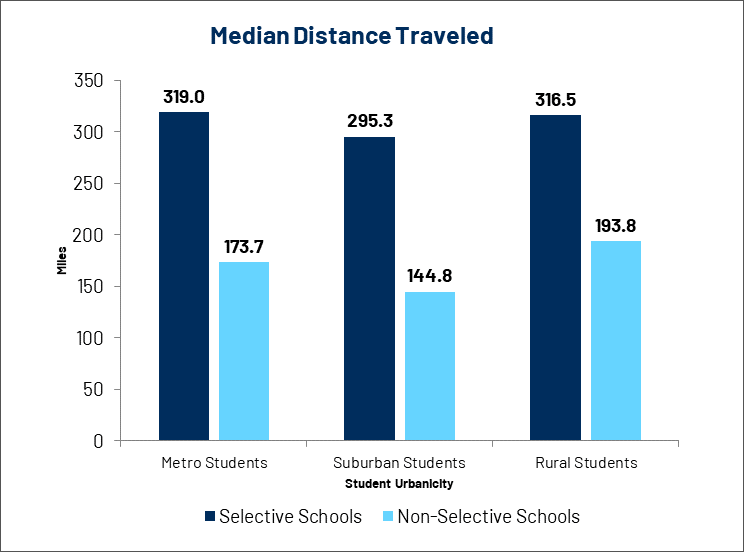
Here, the difference is stark with all student groupings (Metro, Suburban, and Rural) appearing much more open to travelling greater distances to attend Selective Schools.
6. Affluence is Largely Commensurate with Willingness to Travel
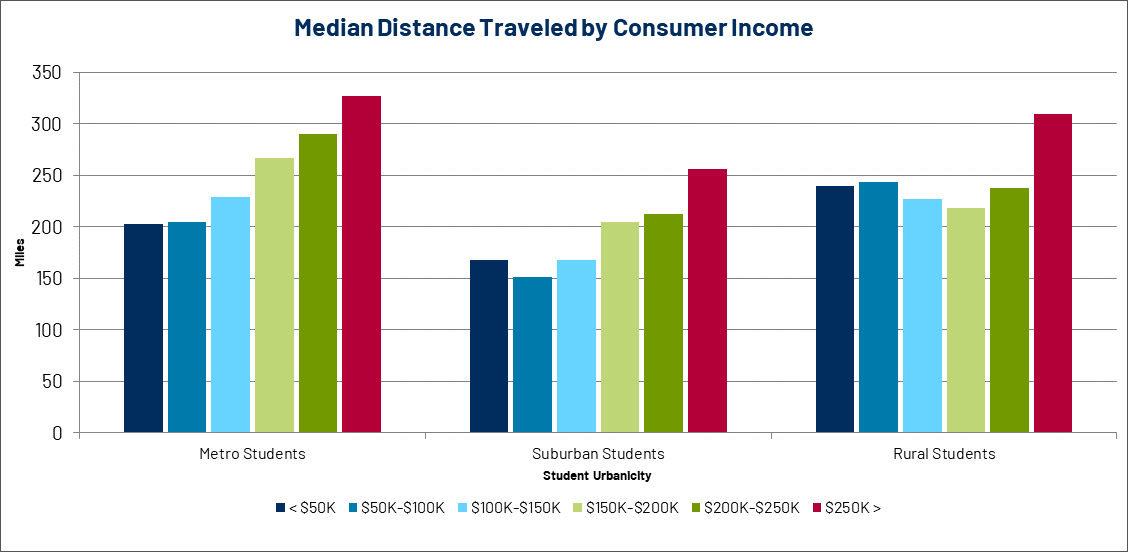
For the most part, students from families with higher incomes show a greater willingness to travel farther to enroll at both Selective and Non-Selective schools. Only among Rural students do we see a slight dip compared to the stairstep bars for Metro.
As you might expect, the financial resources a family has available has a strong compounding effect on college choice.